Identification of Viable Oocytes in Phase Contrast Images Using Deep Learning
In a recent peer-reviewed manuscript published in Biology of Reproduction1, researchers from the University of Pavia, in collaboration with the Evident Technology Center Europe, used TruAI™ deep-learning technology* in cellSens™ software version 3.2 to develop an artificial intelligence (AI) model to distinguish between viable and non-viable oocytes in unstained phase contrast images. This application note explores how TruAI technology is used in the current cellSens version 4.2.1 so that it can be used as a step-by-step guide in similar application trainings.
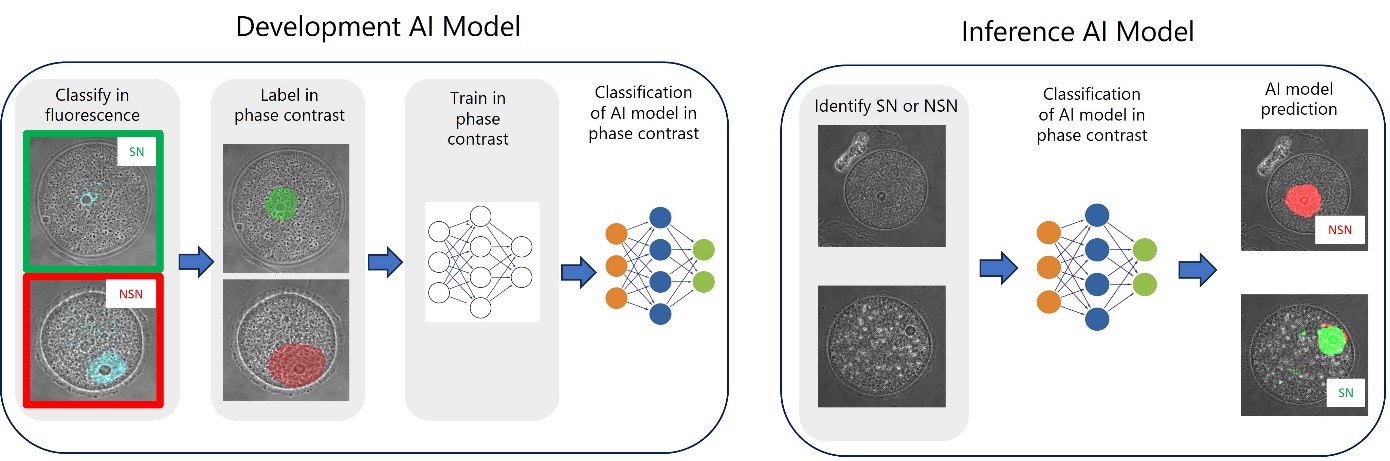
Figure 1. General steps to develop (left) and apply (right) an AI model to distinguish between SN and NSN oocytes in phase contrast images.
A Noninvasive Method for Identifying NSN and SN Oocytes
There are two types of immature oocytes that differ in their heterochromatin configuration, namely SN (surrounded nucleolus) and NSN (non-surrounded nucleolus). NSN oocytes represent 20–30% of the entire antral population and do not progress correctly in their development.2,3 They can be easily identified by using fluorescence microscopy after staining their DNA (Figure 2). However, they are impossible to distinguish using noninvasive imaging techniques, such as phase contrast.
Here we show the development of an AI model to identify SN and NSN immature unstained oocytes from phase contrast images.
Data Set Used to Identify SN and NSN Oocytes in Phase Contrast Images
A total of 183 mouse oocyte images were available for this study (imaged with a FLUOVIEW™ confocal laser scanning microscope using a 60X magnification, a 1.2 numerical aperture (NA), 1024 × 1024 pixels, and a pixel resolution of 159–207 nm/pixel. Each image consists of a Z-stack of 10 to 15 Z-planes spaced at 1 µm, a transmission channel (phase contrast), and a fluorescence channel (Hoechst 33342).
From the naked eye, SN and NSN cannot be distinguished from the phase contrast image. However, SN and NSN can be distinguished by looking at the fluorescence signal: SN oocytes present an intense ring structure around the nucleolus, whereas this ring structure is absent in NSN oocytes (Figure 2).
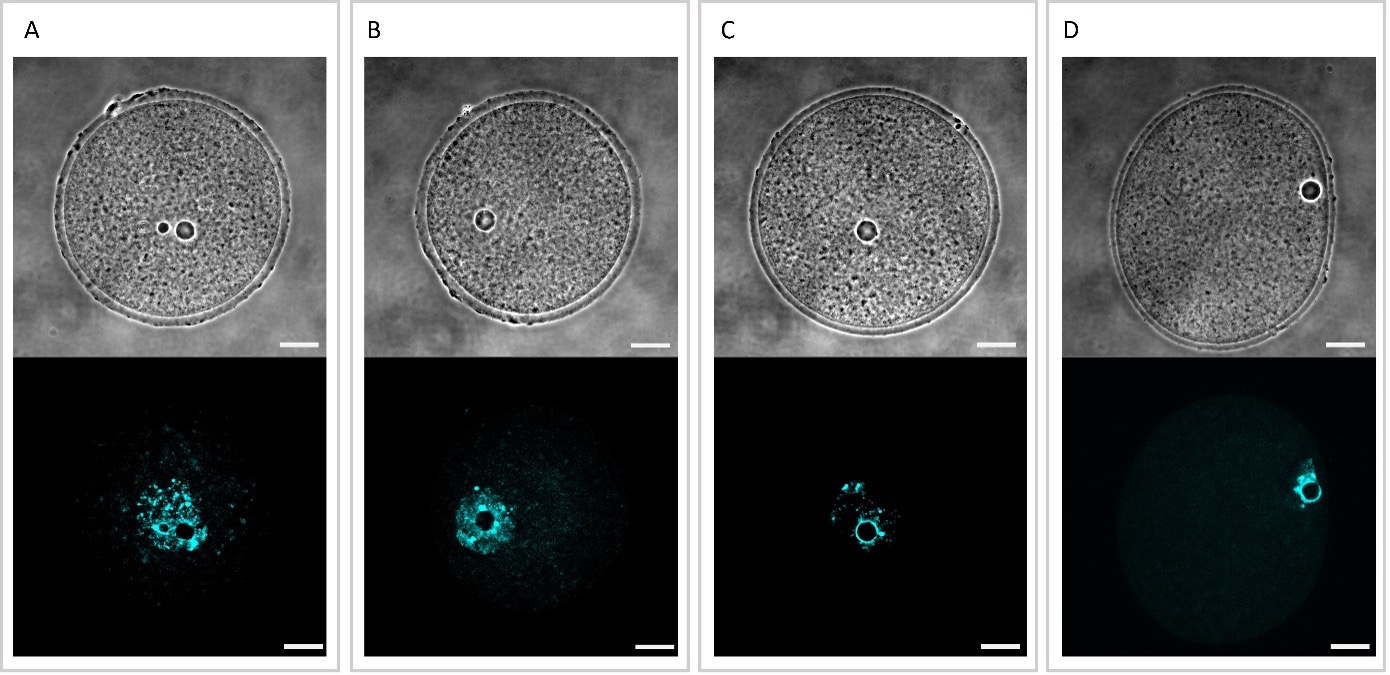
Figure 2. Examples of NSN and SN oocytes imaged in phase contrast (upper row) and fluorescence (lower row). The distinction of NSN (A, B) or SN (C, D) is impossible in phase contrast using the naked eye, but it is easy to determine by looking at the ring formation in the fluorescence signal. Insert bar: 20 m.
By looking at the Hoechst 33342 pattern, all 183 images are classified as SN and NSN, resulting in 86 images for SN oocytes and 97 images for NSN oocytes (Figure 3).
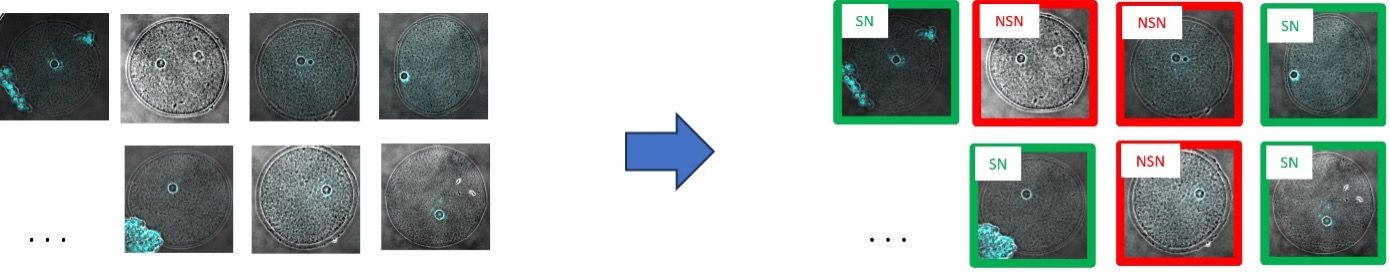
Figure 3. An expert looks at the fluorescence signal and tags all 183 images as an SN or NSN oocyte.
Right after, the data set was split manually into two groups: the training data set (70%, 128 images) and the test data set (30%, 55 images). To test reproducibility, the distribution of images in the training group and test group was different with respect to the original paper.1 We ensured that at least 40% of SN and NSN classes were present in each group. During the training, only the information of the central Z-plane of the phase contrast channel is used. The fluorescence information and the remaining Z-planes are not used during the training (Figure 4).
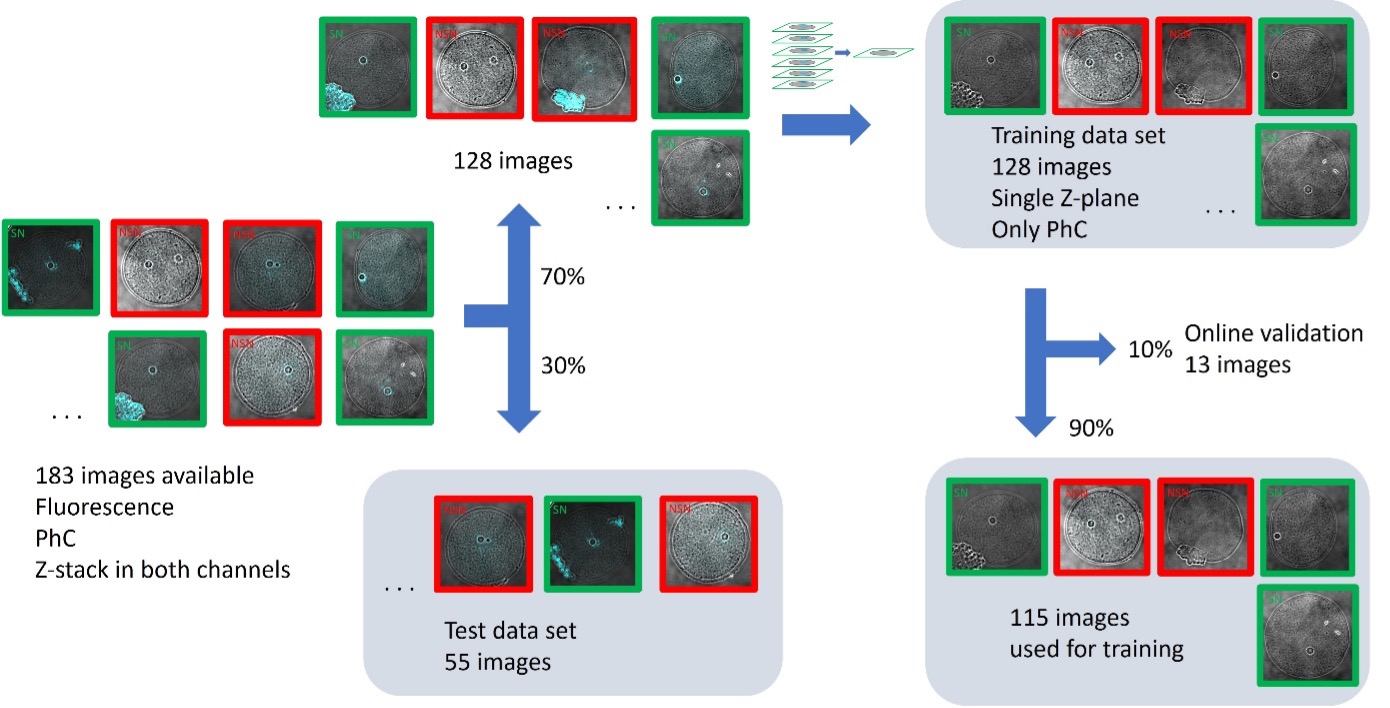
Figure 4. The split of data into training, online validation, and test data sets. The user manually splits the training and test data sets (70–30%). The user also selects the training of single Z-planes of the PhC channel in the training interface. The software automatically performs the split of images for training and online validation (90–10%).
Creating Ground Truth Annotations
For this application note, we used the current cellSens version 4.2.1, which has improvements compared to version 3.2 used in the original paper.1 Both cellSens versions enable you to create ground truth labels for different classes using different colors of a manual painting tool.
For each image, we created three classes: class 1 (NSN: red), class 2 (SN: green), and class 3 (background: yellow). Class 1 and class 2 are assigned to a different level. The different levels enable the pixel overlap of class 1 and class 2 during the training. We labeled only the areas close to the nucleus with either the SN color class (green) or the NSN color class (red), depending on if the image was tagged as SN or NSN, respectively. We only labeled this area because this is where the AI needs to recognize the SN or the NSN features in the phase contrast pattern. All the pixels away from the nuclei areas were labeled as background (yellow).
The software knows that if there is an overlap between the background class (class 3) and a foreground class (class 1 or class 2), those pixels will not be assigned to background. Note that all images need to share the same set of label classes, regardless of whether an image contains labels for all the classes (Figure 5).
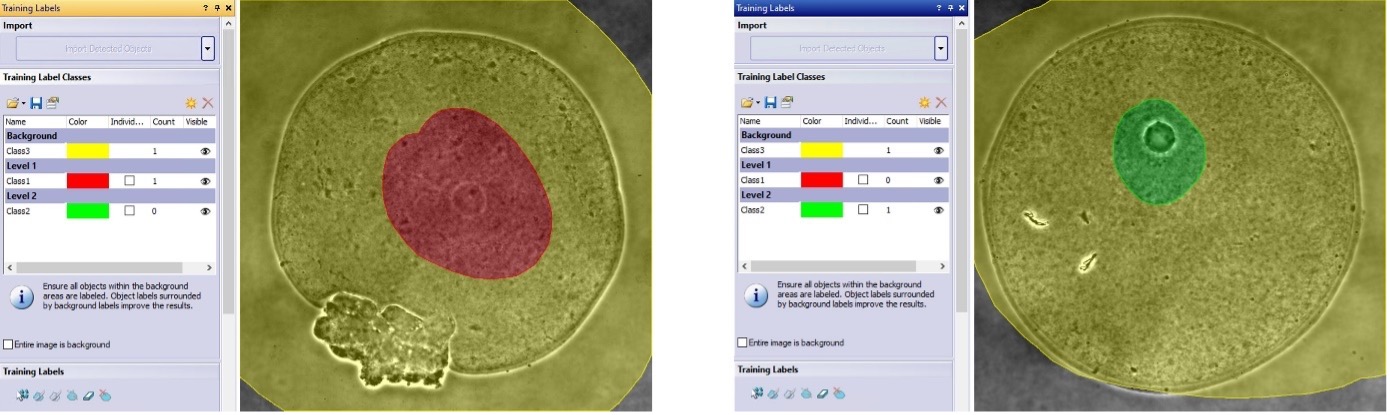
Figure 5. Examples of class annotations in NSN (left) and SN (right) oocyte images. All three classes are present in all images, and the foreground classes are assigned to different levels. The software interprets overlap areas of background (class 3) and foreground classes (class 1 or class 2) as foreground.
Training and Online Validation of the AI Model
The computer used for the training was equipped with a graphics processing unit (GPU) from NVIDIA: model GeForce GTX 1080.
The cellSens software lets users choose from different training configurations (Figure 6). We loaded the 128 images and then selected Expert mode, central Z-slice of the phase contrast as the training channel, and 50% scaling. Pixel class overlap for the foreground classes was pre-set during the labeling, when assigning the two foreground classes to different levels. We left the individual objects tick boxes unchecked, since in this application we are not segmenting individual objects and are only interested in the pixel AI probability. The neural networks are very sensitive to resolution, and the software exclamation symbol shown in Figure 6F warns the user that the images used for the training have different pixel resolutions (between 157 and 207 nm/pixel). However, this warning does not prevent the training.
In the following training window, we chose the Standard Network, which uses a U-Net architecture with 32 feature maps in the first convolution layer, local contrast normalization, and augmentations based on mirroring and 90° rotations. Optimization is done using Adam and a SoftMax cross entropy loss. We selected no limit as the training duration and manually stopped it after about 20 hours.
The introduction of scaling is one notable difference compared to the original paper.1 Scaling resizes the images during training and inference, and it is used to increment the radius of vision of the AI model at the cost of reduced resolution. It makes inference faster and is recommended when training with objects bigger than about 180 pixels in diameter. In this case, the diameter of the areas labeled as class 1 or class 2 is around 300–400 pixels.
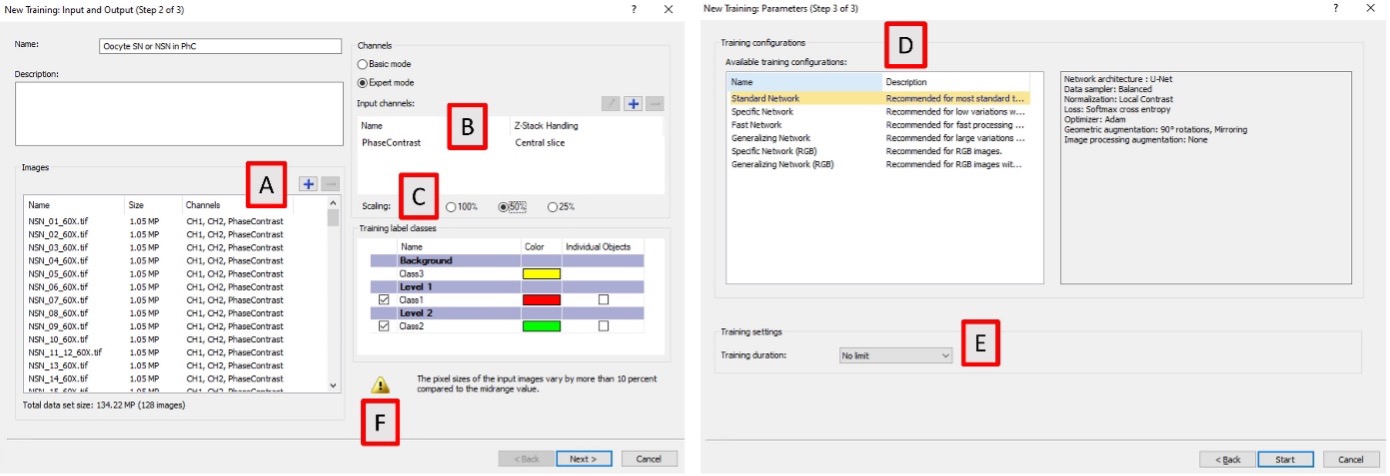
Figure 6. TruAI training configuration in cellSens version 4.2.1. A) Selection of the images for training. B) Selection of the training channel and Z-plane. C) Selection of the scaling factor. D) Selection of the type of neural network to be used along with its description. E) Selection of the training duration. F) Warning to advise of the different pixel resolutions in the images used for the training.
When the training starts, the software automatically sets aside 10% of the loaded images as an online validation set, which is not used for the training. The online validation set is used to check the performance of the deep-learning model as the training progresses. From the total of 183 images, 116 were used for training, 12 were used for online validation, and 55 will be used later for testing the model.
As the training progresses, the user can write checkpoints manually at any time or the software does it automatically at defined iteration numbers (Figure 7A). These checkpoints are AI models. To assess their performance, it is possible to visualize their AI pixel probabilities in the validation images. If the oocyte belongs to the SN or the NSN class, a good AI model produces intense green or red probability pixels around the nuclei, respectively (Figure 7B).
Additionally, metrics of similarity and Intersection over Union (IoU) are displayed in the graphs (Figure 7C). These metrics compare the pixel overlap of the AI model prediction with the ground truth annotations in the training and validation data sets (solid and dotted lines, respectively). The closer they are to 1, the better the model. If the training is progressing correctly, both graphs (training and validation) need to increase with time.
We observed that the training started to produce good results after 50,000 iterations and reached its best performance at an iteration of 213, 442 with a similarity value of 0.76, reached after 3.5 hours training. Compared to the original paper1, this is an improvement in training time and value that we attribute to the scaling factor used. The training graphs also show that after checkpoint 7 with a similarity of 0.76, the training performance continues to increase, whereas the validation performance decreases. This is an indication of overfitting, and increasing the training time will not improve the results.
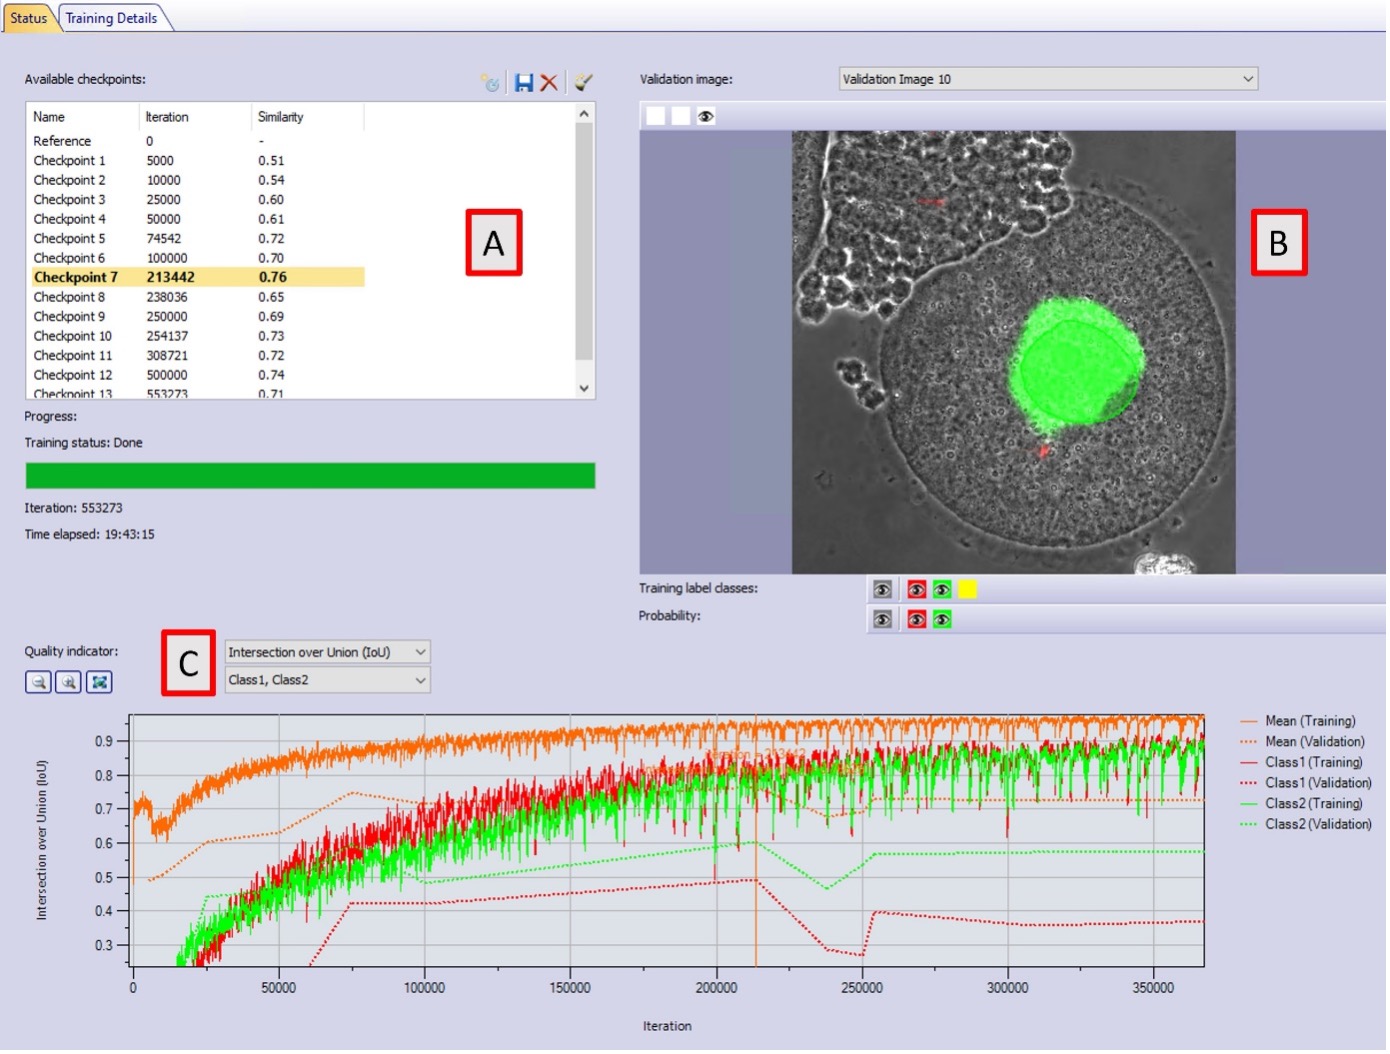
Figure 7. Training interface in cellSens version 4.2.1. A) AI models are produced with their respective iteration number and similarity value. B) Probability map (intense green or red pixels) and annotation overlay (semi-transparent green) in one online validation image. C) Intersection over Union value in the training data set (solid line) and the validation data set (dotted line) for all classes. The graphs indicate overfitting after checkpoint 7.
Validation of the AI Model with the Test Data Set
To determine the accuracy of the trained AI model, we applied it to the test images, which were not used during the training (55 test images, corresponding 22 images to SN and 33 images to NSN). This time, the model was applied to the complete Z-stack of the phase contrast channel to assess if the AI classification is sensitive to the Z-plane.
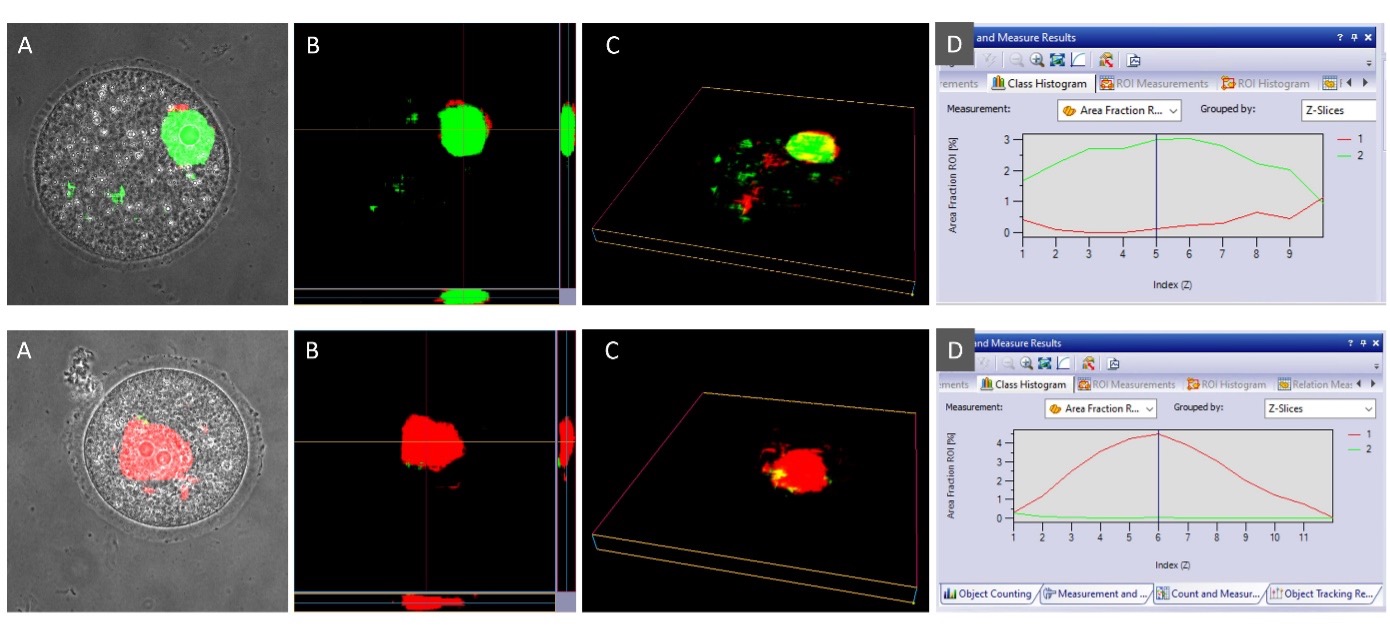
Figure 8. Inference of the developed AI model in phase contrast images of two images from the test data set. The upper row corresponds to a test image for SN, and the lower panel corresponds to a test image for NSN. A) Overlay of the phase contrast channel and the AI probability in the central Z-layer. B) Probability projection across Z. C) Probability voxel view. D). Area fraction of SN and NSN probabilities across Z.
To determine if the overall AI classification for the whole oocyte was correct, 3/4 of the pixels need to be predicted with the correct class when considering all the Z-layers. This calculation was done with the Count and Measure module in cellSens software. The segmented area of the SN and NSN probabilities can be calculated and displayed per Z-layer for each oocyte (Figure 8D). The final results are similar to those obtained in the original publication1 with cellSens version 3.2 and are summarized in Table 1 and Figure 9.
| Correct | Wrong | Uncertain | ||||
|---|---|---|---|---|---|---|
| v. 3.2 | v 4.2.1 | v. 3.2 | v. 4.2.1 | v. 3.2 | v. 4.2.1 | |
| SN (22 images) | 95% | 86% | 5% | 14% | 0% | 0% |
| NSN (33 images) | 82% | 94% | 9% | 3% | 9% | 3% |
Table 1. Performance results of the AI model in the test data set.
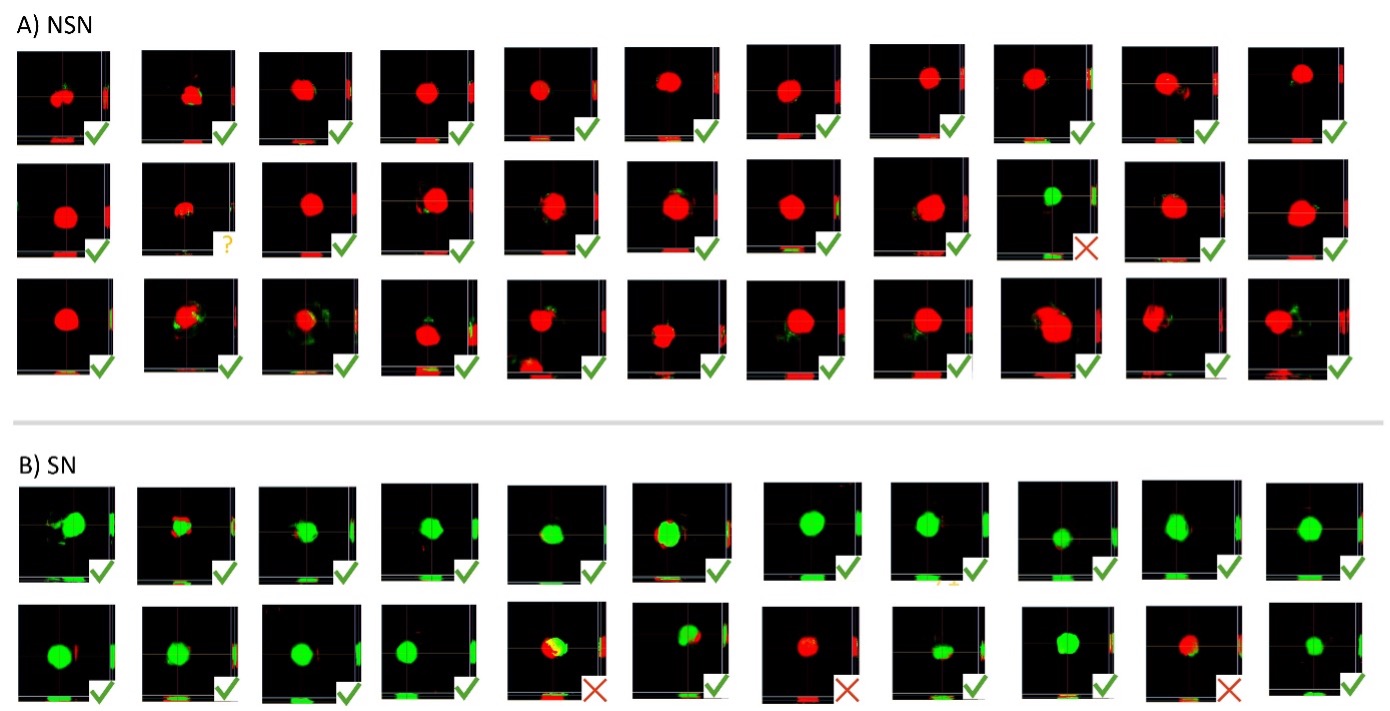
Figure 9. Probability projection across Z for the complete test data set used in this study. A) The upper three rows correspond to NSN oocytes. B) The lower two rows correspond to SN oocytes. Green checkmarks correspond to the correct classification by the AI model. Red cross marks correspond to the wrong classification. The yellow question mark corresponds to uncertain classification, where mostly background was detected.
The Potential of AI Models in Challenging Classification Tasks
These results show that it is possible to use TruAI technology for challenging classification tasks too difficult for the human eye. It opens the possibility of implementation via LiveAI, a functionality in cellSens software that renders the AI probability in live mode—without the need to take an image or conduct an analysis.4
*TruAI module in cellSens software is for research use only.
References
1 Artificial intelligence selection of viable oocytes from phase contrast images for in vitro maturation and fertilization, Biology of Reproduction, 2023, 1–4, https://doi.org/10.1093/biolre/ioad084
2 Debey P, Szöllösi MS, Szöllösi D, Vautier D, Girousse A, Besombes D. Competent mouse oocytes isolated from antral follicles exhibit different chromatin organization and follow different maturation dynamics. Mol Reprod Dev 1993; 36, 59–74.
3 Christians E, Boiani M, Garagna S, Dessy C, Redi CA, Renard JP, Zuccotti M. Gene expression and chromatin organization during mouse oocyte growth. Dev biol 1999; 207:76–85.
4 TruAI Technology, https://olympus-lifescience.com/landing/truai
Authors
Manoel Veiga, Application Specialist, Evident Technology Center Europe
Stefan Diepenbrock, Software Developer, Evident Technology Center Europe
Manuela Monti, Department of Public Health, Forensic and Experimental Medicine, Histology and Embryology Unit, University of Pavia, Pavia, Italy; and Research Center for Regenerative Medicine, Fondazione IRCCS Policlinico San Matteo, Pavia, Italy
Carlo Alberto Redi, Accademia dei Lincei, Rome, Italy
Productos usados para esta aplicación
Sorry, this page is not
available in your country.