The resolution and performance of an optical microscope can be characterized by a quantity known as the modulation transfer function (MTF), which is a measurement of the microscope's ability to transfer contrast from the specimen to the intermediate image plane at a specific resolution. Computation of the modulation transfer function is a mechanism that is often utilized by optical manufacturers to incorporate resolution and contrast data into a single specification.
The modulation transfer function is useful for characterizing not only traditional optical systems, but also photonic systems such as analog and digital video cameras, image intensifiers, and film scanners. This concept is derived from standard conventions utilized in electrical engineering that relate the degree of modulation of an output signal to a function of the signal frequency. In optical microscopy, signal frequency can be equated to a periodicity observed in the specimen, ranging from a metal line grating evaporated onto a microscope slide or repeating structures in a diatom frustule to subcellular particles observed in living tissue culture cells.
The number of spacings per unit interval in a specimen is referred to as the spatial frequency, which is usually expressed in quantitative terms of the periodic spacings (spatial period) found in the specimen. A common reference unit for spatial frequency is the number of line pairs per millimeter. As an example, a continuous series of black and white line pairs with a spatial period measuring 1 micrometer per pair would repeat 1000 times every millimeter and therefore have a corresponding spatial frequency of 1000 lines per millimeter.
Another important concept is the optical transfer function (OTF), which represents the ratio of image contrast to specimen contrast when plotted as a function of spatial frequency, taking into account the phase shift between positions occupied by the actual and ideal image. In general terms, the optical transfer function can be described as:
in which the imaginary term represents the phase transfer function (PTF), or the change in phase position as a function of spatial frequency. Therefore, the optical transfer function is a spatial frequency-dependent complex variable whose modulus is the modulation transfer function, and whose phase is described by the phase transfer function. If the phase transfer function is linear with frequency, it represents a simple lateral displacement of the image as would be observed with an aberration such as geometric distortion. However, if the phase transfer function is nonlinear, it can adversely affect image quality. In the most dramatic example, a phase shift of 180 degrees produces a reversal of image contrast, where light and dark patterns are inverted.
A perfect optical system would have a modulation transfer function of unity at all spatial frequencies, while simultaneously having a phase transfer factor of zero. In cases where the image produced by the microscope (or other optical system) is sinusoidal and there is no significant phase shift, the modulus of the optical transfer function reverts to the modulation transfer function.
In situations where the specimen is a periodic line grating composed of alternating black and white lines of equal width (square waves), a graph relating the percentage of specimen contrast transferred to the image is known as the contrast transfer function (CTF). Most specimens display a composition of sinusoidally varying intensities having differing spatial frequencies instead of distinct sharp profiles in the form of square waves. In this case, a graph relating output as a fraction of input intensity versus signal (spatial) frequency is analogous to the modulation transfer function. As the spatial frequency approaches very large values, the square wave response resembles that of a sinusoid, yielding graphs of the contrast transfer function and the modulation transfer function that are virtually identical.
Diffraction Effects on Image Contrast
Observe how image contrast decreases as a function of increasing spatial frequency in specimen details with diffraction-limited optical systems.
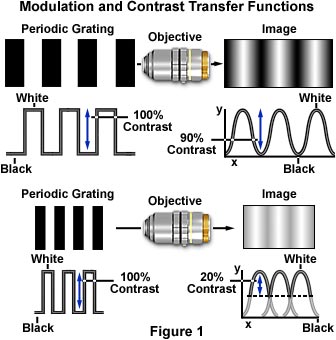
Start Tutorial »The effect of increasing spatial frequency on image contrast in a diffraction-limited optical microscope is illustrated in Figure 1. A periodic line grating consisting of alternating white and black rectangular bars (representing 100 percent contrast) is presented at two spatial frequencies on the left-hand side of the figure. The resulting image produced in the microscope is shown on the right side of each objective, and appears as a sinusoidal intensity that has reduced contrast, which is plotted in the graph below the image in terms of a relative percentage of the object contrast. One hundred percent contrast represents regular white and black repeating bars, while zero percent contrast is manifested by gray bars that blend into a gray background of the same intensity. After the contrast value reaches zero, the image becomes a uniform shade of gray, and remains as such for all higher spatial frequencies.
When the input is a high contrast square wave, such as the periodic grating target illustrated in Figure 1, transfer of contrast is determined by the contrast transfer function. A majority of specimens observed in the microscope, however, do not display such a regular periodicity and consist of "square waves" that are sinusoidal to varying degrees at the sub-micron level. In this case, the modulation transfer function is utilized to calculate transfer of contrast from the specimen to the image produced by the microscope.
Modulation of the output signal, the intensity of light waves forming an image of the specimen, corresponds to the formation of image contrast in microscopy. Therefore, a measurement of the MTF for a particular optical microscope can be obtained from the contrast generated by periodic lines or spacings present in a specimen that result from sinusoidal intensities in the image that vary as a function of spatial frequency. If a specimen having a spatial period of 1 micron (the distance between alternating absorbing and transparent line pairs) is imaged at high numerical aperture (1.40) with a matched objective/condenser pair using immersion oil, the individual line pairs would be clearly resolved in the microscope. The image would not be a faithful reproduction of the line pair pattern, but would instead have a moderate degree of contrast between the dark and light bars (Figure 1). Decreasing the distance between the line pairs to a spatial period of 0.5 microns (spatial frequency equal to 2000 lines per millimeter) would further reduce contrast in the final image, but increasing the spatial period to 2 microns (spatial frequency equal to 500 lines per millimeter) would produce a corresponding increase in image contrast.
The limit of resolution with an optical microscope is reached when the spatial frequency approaches 5000 lines per millimeter (spatial period equal to 0.2 microns), using an illumination wavelength of 500 nanometers at high numerical aperture (1.4). At this point, contrast would be barely detectable and the image would appear a neutral shade of gray. In real specimens, the amount of contrast observed in a microscope depends upon the size, brightness, and color of the image, but the human eye ceases to detect periodicity at contrast levels below about three to five percent for closely spaced stripes and may not reach the 0.2-micron limit of resolution.
When a specimen is observed in an optical microscope, the resulting image will be somewhat degraded due to aberrations and diffraction phenomena, in addition to minute assembly and alignment errors in the optics. In the image, bright highlights will not appear as bright as they do in the specimen, and dark or shadowed areas will not be as black as those observed in the original patterns. The specimen contrast or modulation can be defined as:
where I(max) is the maximum intensity displayed by a repeating structure and I(min) is the minimum intensity found in the same specimen. By convention, the modulation transfer function is normalized to unity at zero spatial frequency. Modulation is typically less in the image than in the specimen and there is often a slight phase displacement of the image relative to the specimen. By comparing several specimens having differing spatial frequencies, it can be determined that both image modulation and phase shifts will vary as a function of spatial frequency. By definition, the modulation transfer function (MTF) is described by the equation:
This quantity, as discussed above, is an expression of the contrast alteration observed in the image of a sinusoidal object as a function of spatial frequency. In addition, there is a position or phase shift of the sinusoid that is dependent upon spatial frequency in both the horizontal and vertical coordinates. A good example occurs in video microscopy where the raster scanning process produces slightly different responses resulting in a variation between the horizontal and vertical modulation transfer functions.
The phase response from an ideal imaging system demonstrates a linear dependence on spatial frequency, with a position shift that is independent of the frequency and normalized to zero at zero spatial frequency. In the ideal system, all sinusoidal image components are displaced by the same amount, resulting in a net position shift for the image without degradation of image quality. When the phase response deviates from ideal linear behavior, then some components will be shifted to a greater degree than others resulting in image degradation. This is especially critical in electronic video systems, which often possess less than ideal phase characteristics that can lead to noticeable loss of image quality. Fortunately, an ideal aberration-free optical system having a circular aperture and a centered optical axis (such as a high-performance microscope) will produce a phase transfer function that has a value of zero for all spatial frequencies in all directions. In this case, phase shifts occur exclusively for off-axis rays and only the modulation transfer function need be considered.
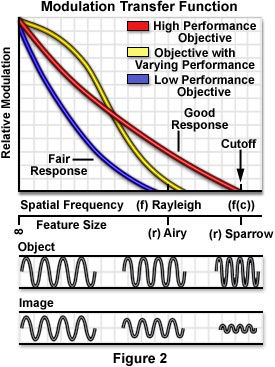
A perfect aberration-free optical system is termed diffraction limited, because the effects of light diffraction at the pupils limit the spatial frequency response and establish the limits of resolution. Presented in Figure 2 is a graph relating the modulation transfer function of a repeating specimen imaged with incoherent illumination by visible light with several different diffraction-limited microscope objectives having a circular pupil. In this case, objective quality affects the modulation response as a function of spatial frequency. Higher quality objectives (red line in Figure 2) exhibit greater performance than those of a lower quality (yellow line), and are able to transfer contrast more effectively at higher spatial frequencies. The objective represented by the yellow curve has the highest performance at low spatial frequencies, but falls short of the high numerical aperture objective at larger frequencies. Beneath the graph is a representation of relative feature size versus spatial frequency with respect to the Rayleigh criteria and Sparrow limit. Also presented is a series of sine waves representing a specimen (object) and the resulting image produced in a typical microscope as the frequency of the sinusoid increases.
When there are no significant aberrations present in an optical system, the modulation transfer function is related to the size of the diffraction pattern, which is a function of the system numerical aperture and wavelength of illumination. In quantitative terms, the modulation transfer function for an optical system with a uniformly illuminated circular aperture can be expressed as:
where
In these equations, υ is the frequency in cycles per millimeter, λ is the wavelength of illumination, and NA is the numerical aperture. At low spatial frequencies, image contrast is the highest, but falls to zero as the spatial frequency is increased beyond a certain point (drawn in Figure 2 as a reduction in amplitude produced in the image). The cutoff (f(c)) is the spatial frequency at which contrast reaches zero and can be expressed by the equation:
It is interesting to note that this equation expresses (in terms of spatial frequency) the fact that resolution increases with both numerical aperture and shorter wavelengths.
The modulation transfer function is also related to the point spread function, which is the image of a point source of light (commonly referred to as the Airy disk) from the specimen projected by the microscope objective onto the intermediate image plane. Optical aberrations and numerical aperture variations affect the distribution of light intensity observed at the image plane, and thus influence the shape of the point spread function. Also note that the sum of the point spread functions produced by a specimen in a diffraction-limited microscope comprises the diffraction pattern produced at the image plane.
The highest spatial frequencies that can be imaged by a microscope objective are proportional to the numerical aperture and are based on the distribution size of the point spread function. Objectives with low numerical apertures produce point spread functions that have a wider intensity distribution at the image plane than those formed by objectives with higher numerical apertures. At the limit of resolution, adjacent Airy disks or point spread functions start to overlap, obscuring the ability to distinguish between individual intensities. Narrower intensity distributions (at higher numerical apertures) can approach each other more closely and still be resolved by the microscope. This implies that a narrow point spread function corresponds to a high spatial frequency. In fact, the optical transfer function, a measure of spatial frequency response for an optical system, is the mathematical Fourier transform of the point spread function.
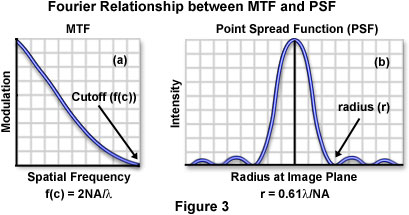
The relationship between the modulation transfer function and the point spread function for a diffraction-limited optical microscope is illustrated in Figure 3. As discussed above, the limiting cutoff frequency (f(c)) of the modulation transfer function is directly proportional to the objective numerical aperture and inversely proportional to the illumination wavelength. The radius of the first dark concentric ring surrounding the central intensity peak of a point spread function (or Airy disk) is expressed by the equation:
which is more commonly referred to as the Rayleigh criterion, or the resolution limit of the microscope. Because r is inversely proportional to numerical aperture and directly proportional to the illuminating wavelength, it follows that r and f(c) are also inversely proportional, a fundamental property of Fourier transforms (the width of a function is inversely proportional to the width of its transform).
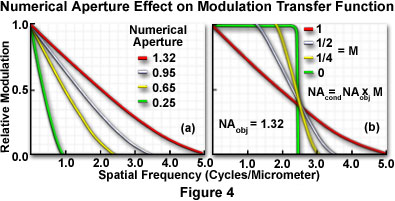
Individual objectives in a microscope display a specific modulation transfer function (or optical transfer function) that depends on numerical aperture, objective design, illumination wavelength, and the mode of contrast generation. When the numerical aperture of the condenser is equal to or greater than that of the objective, the spatial frequency cutoff value decreases with decreasing objective numerical aperture (Figure 4(a)). Holding the objective numerical aperture value constant and varying the condenser numerical aperture results in progressively lower cutoff values with decreasing condenser numerical aperture (Figure 4(b)).
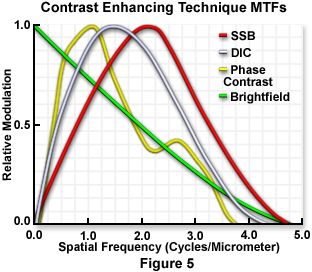
Utilization of contrast enhancing techniques such as phase contrast and differential interference contrast (DIC) results in unique modulation transfer functions that display curves markedly different from those observed in brightfield illumination using the objective's full numerical aperture (Figure 5). For example, the narrow illumination produced by phase rings in phase contrast microscopy produces a modulation transfer function curve that oscillates above and below the brightfield curve, while the curves generated by DIC objectives vary with the angle between the specimen period and the shear direction of the Wollaston or Nomarski prisms. Also illustrated in Figure 5 is the curve produced by a single-sideband edge enhancement microscope (developed by Dr. Gordon W. Ellis), which yields images of superior contrast at high spatial frequencies.
In practice, the performance of a microscope objective or other lens system is often determined by tracing a large number of light rays emitted by a point source in a uniformly distributed array over the vignetted entrance pupil of the objective. After passing through the exit pupil and being distributed over the image plane, the ray intersections are used to plot a spot diagram of the light points at the image plane. In most cases, several hundred rays are utilized to construct a spot diagram, which may take into account optical aberrations if the spacings of light rays are so adjusted. The resulting spot diagram is then regarded as a point spread function and is converted into a graph of the modulation transfer function versus spatial frequency by means of a Fourier transform.
Direct measurements of the modulation transfer function are conducted by utilizing specific test pattern targets consisting of high-contrast periodic line gratings having a series of spacings that usually range from one or several millimeters down to 0.1 micrometer, as illustrated in Figure 8. These targets allow evaluation of microscope objective diffraction patterns, both in and out of focus, in a variety of contrast enhancing modes. Detector arrays are utilized to measure the distribution of light in the image plane by summation of the point spread functions, and a Fourier transform algorithm applied to the data to determine the modulation transfer function.
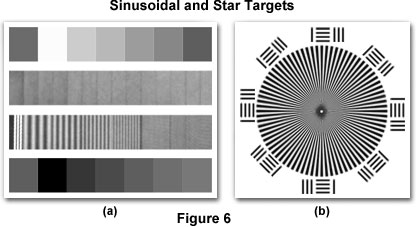
The target presented in Figure 6(a) is designed specifically for testing the horizontal modulation transfer function of a macro imaging system such as a telescope, binoculars, video system, camera, or digital video recorder. It is composed of sinusoidal patterns having a spatial frequency range between 0.2 and 80 line pairs per millimeter with a grayscale optical density range varying between 0.2 and 1.2 and an 80 percent modulation of the sine waves. This type of target relays image quality information over a wide range of frequencies and contains on-target references for denoting the contrast levels of the sinusoidal frequencies. In video microscopy, microscopic test targets of sinusoidal targets are not readily available, so the contrast transfer function of a video detector coupled to the microscope is often determined rather than the modulation transfer function.
In systems that have a circular aperture (such as an optical microscope), the modulation and/or contrast transfer function is often computed or measured with star and bar targets similar to the one illustrated in Figure 6(b). Targets of this type have both radial and tangential patterns that are orthogonal to each other and are also useful for detecting focus errors and aberrations such as astigmatism. Variations of the basic star target design contain paired lines and dots that allow determination of objective diffraction patterns both in and out of focus and are useful for measurements conducted in brightfield, reflection contrast, or epifluorescence illumination modes. The wedge and bar spacing period ranges from 0.1 micrometer to tens of microns with spatial frequencies between 0.2 and 25 line pairs per millimeter. Radial modulation transfer targets are ideal for high-resolution measurements using photographic film or analog sensors, but the horizontal and vertical pixelated nature of CCD detectors benefits from analysis utilizing targets that are geometrically consistent with the pixel rows and columns of the imaging device.
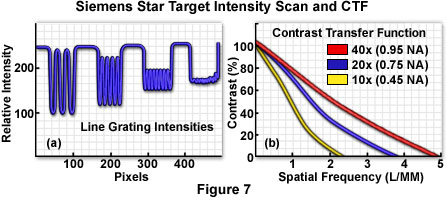
A typical intensity scan made from a star target measured with a high numerical aperture apochromatic objective operating in transmitted light mode is presented in Figure 7(a). Intensity values were averaged over the dimension parallel to the target grating lines. When these types of data are collected for a variety of objectives at varying numerical aperture and plotted as percent contrast versus spatial frequency, a graph similar to that illustrated in Figure 7(b) is obtained. Contrast transfer approaches 100 percent at very low spatial frequencies (wide spacing periods) and gradually drops with increasing spatial frequency. As spatial frequencies reach the Abbe limit (the imaging wavelength divided by twice the objective numerical aperture), contrast values are generally too low to detect individual spacings in the line grating.
In some instances, the modulation transfer function of an optical microscope can actually be less than zero. This occurs in an otherwise functional system when performance is degraded due to defocus, aberrations, and/or manufacturing errors. Often, the modulation transfer function will oscillate above and below zero as the microscope is racked through the point of best focus on a specimen having features with high spatial frequency. When the transfer function dips below zero, the image undergoes a phase reversal in which dark features become bright and vice versa.
This phenomenon is illustrated in Figure 8(a) for the periodic knobs imaged from the curved surface of a diatom frustule. As the microscope focus is changed, the knobs undergo inversion of contrast, producing a ripple effect in the relative modulation (compare knobs (1) through (5) in Figure 8(a)). Increasing the degree of defocus will produce a corresponding increase in the oscillations observed with a modulation transfer function plot, with contrast reversals affecting increasingly larger features in the image. As the specimen plane is defocused, contrast drops rapidly for microscopic feature having high spatial frequencies and more slowly for those with low frequencies. It is often useful to measure contrast at a particular spatial frequency and then follow contrast as a function of distance on either side of the image plane. This analysis is sometimes termed the through-focus transfer function and is a measure of the depth of focus for a particular objective.
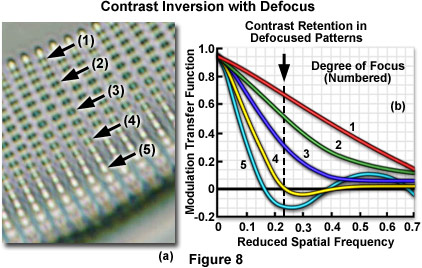
The relationship between spatial frequency and the modulation transfer function for the diatom is illustrated in Figure 8(b). The graph represents a series of varying focus levels where the measured MTF is plotted against spatial frequency (number of sinusoidal features per unit distance). A drop in relative modulation values with defocus at fixed spatial frequencies is obvious in the figure, as well as the contrast reversal at focus levels 4 and 5 where the reduced spatial frequency drops into negative values of the MTF. Curve number 1 represents the diatom frustule in focus, and curves 2 through 5 present the results with successively increasing levels of defocus. The dotted line corresponds to the approximate spatial frequency of the knobs illustrated in Figure 8(a). Contrast is at a minimum where the dotted line crosses curve 4 and is reversed where curve 5 dips below zero on the y-axis.
All optical systems and supporting components including microscopes, digital and analog video systems, video capture boards, cables, computer monitors, photographic film emulsions, and the human eye each have a characteristic modulation transfer function. In the case of analog and digital electronic imaging detectors, the reciprocal relationship discussed above between spatial resolution and frequency response is valid. In this case, however, the point spread function is replaced by the time response to a very short electrical impulse, and the optical transfer function is replaced by the imaging system's response to the sinusoidal electrical signal with respect to amplitude and phase. Electronic systems lack the symmetry of optical systems, which introduces non-linear phase effects into the function. Regardless of these differences, the underlying concepts are similar between electronic and optical systems, and this allows optical microscopes coupled to digital (or analog) imaging equipment to be analyzed within a common framework.
The modulation transfer function of an optical system that contains a cascading series of components (microscope, digital video camera, video capture board, computer monitor, etc.) can be calculated by multiplying the individual MTF's of each component. By conducting a careful analysis of the combined system modulation transfer functions, a prediction about performance of the system can be obtained. In the same manner, the system phase response can be obtained by adding the phase transfer functions of individual components (Note: phase transfer functions are summed while modulation transfer functions are multiplied). Together, the modulation and phase transfer functions define the optical transfer function of the system. It is important to point out that the contrast transfer function does not have the same mathematical properties as the modulation transfer function and cannot be obtained simply by multiplying the CTF of individual components.
In a cascaded series of devices that work together to produce an image, contrast is lost in certain frequency regions at each step, generally at the higher end of the spatial frequency range. In this regard, each detector or image processing function can also be used to cut off or boost the modulation transfer function at certain frequencies. At each stage, noise introduced by image transfer and processing is also a function of spatial frequency. Therefore, fine-tuning the response for optimum image contrast and system performance is dependent not only upon the type of image information desired, but also the frequency dependence of noise levels in the image. In addition, because the modulation transfer function of a detector is wavelength-dependent, it must be determined under carefully defined conditions of illumination.
The modulation transfer function has not yet been established for several contrast enhancing modes commonly utilized in optical microscopy (such as polarized light), which await more highly perfected theories of image formation and appropriate test patterns (or specimens) to determine, by experiment, the MTF values.
