Basic Concepts in Fluorescence
Fluorescence is a member of the ubiquitous luminescence family of processes in which susceptible molecules emit light from electronically excited states created by either a physical (for example, absorption of light), mechanical (friction), or chemical mechanism. Generation of luminescence through excitation of a molecule by ultraviolet or visible light photons is a phenomenon termed photoluminescence, which is formally divided into two categories, fluorescence and phosphorescence, depending upon the electronic configuration of the excited state and the emission pathway. Fluorescence is the property of some atoms and molecules to absorb light at a particular wavelength and to subsequently emit light of longer wavelength after a brief interval, termed the fluorescence lifetime. The process of phosphorescence occurs in a manner similar to fluorescence, but with a much longer excited state lifetime.
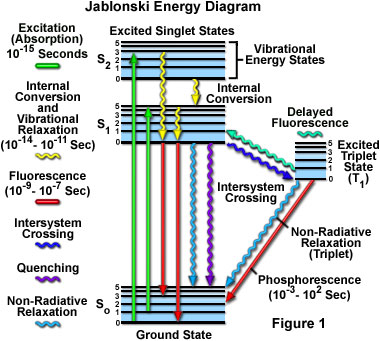
The fluorescence process is governed by three important events, all of which occur on timescales that are separated by several orders of magnitude (see Table 1). Excitation of a susceptible molecule by an incoming photon happens in femtoseconds (10E-15 seconds), while vibrational relaxation of excited state electrons to the lowest energy level is much slower and can be measured in picoseconds (10E-12 seconds). The final process, emission of a longer wavelength photon and return of the molecule to the ground state, occurs in the relatively long time period of nanoseconds (10E-9 seconds). Although the entire molecular fluorescence lifetime, from excitation to emission, is measured in only billionths of a second, the phenomenon is a stunning manifestation of the interaction between light and matter that forms the basis for the expansive fields of steady state and time-resolved fluorescence spectroscopy and microscopy. Because of the tremendously sensitive emission profiles, spatial resolution, and high specificity of fluorescence investigations, the technique is rapidly becoming an important tool in genetics and cell biology.
Several investigators reported luminescence phenomena during the seventeenth and eighteenth centuries, but it was British scientist Sir George G. Stokes who first described fluorescence in 1852 and was responsible for coining the term in honor of the blue-white fluorescent mineral fluorite (fluorspar). Stokes also discovered the wavelength shift to longer values in emission spectra that bears his name. Fluorescence was first encountered in optical microscopy during the early part of the twentieth century by several notable scientists, including August Köhler and Carl Reichert, who initially reported that fluorescence was a nuisance in ultraviolet microscopy. The first fluorescence microscopes were developed between 1911 and 1913 by German physicists Otto Heimstädt and Heinrich Lehmann as a spin-off from the ultraviolet instrument. These microscopes were employed to observe autofluorescence in bacteria, animal, and plant tissues. Shortly thereafter, Stanislav Von Provazek launched a new era when he used fluorescence microscopy to study dye binding in fixed tissues and living cells. However, it wasn't until the early 1940s that Albert Coons developed a technique for labeling antibodies with fluorescent dyes, thus giving birth to the field of immunofluorescence. By the turn of the twenty-first century, the field of fluorescence microscopy was responsible for a revolution in cell biology, coupling the power of live cell imaging to highly specific multiple labeling of individual organelles and macromolecular complexes with synthetic and genetically encoded fluorescent probes.
Timescale Range for Fluorescence Processes
| Transition | Process | Rate Constant | Timescale (Seconds) |
|---|---|---|---|
| S(0) => S(1) or S(n) | Absorption (Excitation) | Instantaneous | 10-15 |
| S(n) => S(1) | Internal Conversion | k(ic) | 10-14 to 10-10 |
| S(1) => S(1) | Vibrational Relaxation | k(vr) | 10-12 to 10-10 |
| S(1) => S(0) | Fluorescence | k(f) or Γ | 10-9 to 10-7 |
| S(1) => T(1) | Intersystem Crossing | k(pT) | 10-10 to 10-8 |
| S(1) => S(0) | Non-Radiative Relaxation Quenching | k(nr), k(q) | 10-7 to 10-5 |
| T(1) => S(0) | Phosphorescence | k(p) | 10-3 to 100 |
| T(1) => S(0) | Non-Radiative Relaxation Quenching | k(nr), k(qT) | 10-3 to 100 |
Table 1
Fluorescence is generally studied with highly conjugated polycyclic aromatic molecules that exist at any one of several energy levels in the ground state, each associated with a specific arrangement of electronic molecular orbitals. The electronic state of a molecule determines the distribution of negative charge and the overall molecular geometry. For any particular molecule, several different electronic states exist (illustrated as S(0), S(1), and S(2) in Figure 1), depending on the total electron energy and the symmetry of various electron spin states. Each electronic state is further subdivided into a number of vibrational and rotational energy levels associated with the atomic nuclei and bonding orbitals. The ground state for most organic molecules is an electronic singlet in which all electrons are spin-paired (have opposite spins). At room temperature, very few molecules have enough internal energy to exist in any state other than the lowest vibrational level of the ground state, and thus, excitation processes usually originate from this energy level.
The category of molecules capable of undergoing electronic transitions that ultimately result in fluorescence are known as fluorescent probes, fluorochromes, or simply dyes. Fluorochromes that are conjugated to a larger macromolecule (such as a nucleic acid, lipid, enzyme, or protein) through adsorption or covalent bonds are termed fluorophores. In general, fluorophores are divided into two broad classes, termed intrinsic and extrinsic. Intrinsic fluorophores, such as aromatic amino acids, neurotransmitters, porphyrins, and green fluorescent protein, are those that occur naturally. Extrinsic fluorophores are synthetic dyes or modified biochemicals that are added to a specimen to produce fluorescence with specific spectral properties.
Absorption, Excitation, and Emission
Absorption of energy by fluorochromes occurs between the closely spaced vibrational and rotational energy levels of the excited states in different molecular orbitals. The various energy levels involved in the absorption and emission of light by a fluorophore are classically presented by a Jablonski energy diagram (see Figure 1), named in honor of the Polish physicist Professor Alexander Jablonski. A typical Jablonski diagram illustrates the singlet ground (S(0)) state, as well as the first (S(1)) and second (S(2)) excited singlet states as a stack of horizontal lines. In Figure 1, the thicker lines represent electronic energy levels, while the thinner lines denote the various vibrational energy states (rotational energy states are ignored). Transitions between the states are illustrated as straight or wavy arrows, depending upon whether the transition is associated with absorption or emission of a photon (straight arrow) or results from a molecular internal conversion or non-radiative relaxation process (wavy arrows). Vertical upward arrows are utilized to indicate the instantaneous nature of excitation processes, while the wavy arrows are reserved for those events that occur on a much longer timescale.
Absorption of light occurs very quickly (approximately a femtosecond, the time necessary for the photon to travel a single wavelength) in discrete amounts termed quanta and corresponds to excitation of the fluorophore from the ground state to an excited state. Likewise, emission of a photon through fluorescence or phosphorescence is also measured in terms of quanta. The energy in a quantum (Planck's Law) is expressed by the equation:
E = hν = hc/λ
where E is the energy, h is Planck's constant, ν and λ are the frequency and wavelength of the incoming photon, and c is the speed of light. Planck's Law dictates that the radiation energy of an absorbed photon is directly proportional to the frequency and inversely proportional to the wavelength, meaning that shorter incident wavelengths possess a greater quantum of energy. The absorption of a photon of energy by a fluorophore, which occurs due to an interaction of the oscillating electric field vector of the light wave with charges (electrons) in the molecule, is an all or none phenomenon and can only occur with incident light of specific wavelengths known as absorption bands. If the absorbed photon contains more energy than is necessary for a simple electronic transition, the excess energy is usually converted into vibrational and rotational energy. However, if a collision occurs between a molecule and a photon having insufficient energy to promote a transition, no absorption occurs. The spectrally broad absorption band arises from the closely spaced vibrational energy levels plus thermal motion that enables a range of photon energies to match a particular transition. Because excitation of a molecule by absorption normally occurs without a change in electron spin-pairing, the excited state is also a singlet. In general, fluorescence investigations are conducted with radiation having wavelengths ranging from the ultraviolet to the visible regions of the electromagnetic spectrum (250 to 700 nanometers).
With ultraviolet or visible light, common fluorophores are usually excited to higher vibrational levels of the first (S(1)) or second (S(2)) singlet energy state. One of the absorption (or excitation) transitions presented in Figure 1 (left-hand green arrow) occurs from the lowest vibrational energy level of the ground state to a higher vibrational level in the second excited state (a transition denoted as S(0) = 0 to S(2) = 3). A second excitation transition is depicted from the second vibrational level of the ground state to the highest vibrational level in the first excited state (denoted as S(0) = 1 to S(1) = 5). In a typical fluorophore, irradiation with a wide spectrum of wavelengths will generate an entire range of allowed transitions that populate the various vibrational energy levels of the excited states. Some of these transitions will have a much higher degree of probability than others, and when combined, will constitute the absorption spectrum of the molecule. Note that for most fluorophores, the absorption and excitation spectra are distinct, but often overlap and can sometimes become indistinguishable. In other cases (fluorescein, for example) the absorption and excitation spectra are clearly separated.
Immediately following absorption of a photon, several processes will occur with varying probabilities, but the most likely will be relaxation to the lowest vibrational energy level of the first excited state (S(1) = 0; Figure 1). This process is known as internal conversion or vibrational relaxation (loss of energy in the absence of light emission) and generally occurs in a picosecond or less. Because a significant number of vibration cycles transpire during the lifetime of excited states, molecules virtually always undergo complete vibrational relaxation during their excited lifetimes. The excess vibrational energy is converted into heat, which is absorbed by neighboring solvent molecules upon colliding with the excited state fluorophore.
An excited molecule exists in the lowest excited singlet state (S(1)) for periods on the order of nanoseconds (the longest time period in the fluorescence process by several orders of magnitude) before finally relaxing to the ground state. If relaxation from this long-lived state is accompanied by emission of a photon, the process is formally known as fluorescence. The closely spaced vibrational energy levels of the ground state, when coupled with normal thermal motion, produce a wide range of photon energies during emission. As a result, fluorescence is normally observed as emission intensity over a band of wavelengths rather than a sharp line. Most fluorophores can repeat the excitation and emission cycle many hundreds to thousands of times before the highly reactive excited state molecule is photobleached, resulting in the destruction of fluorescence. For example, the well-studied probe fluorescein isothiocyanate (FITC) can undergo excitation and relaxation for approximately 30,000 cycles before the molecule no longer responds to incident illumination.
Several other relaxation pathways that have varying degrees of probability compete with the fluorescence emission process. The excited state energy can be dissipated non-radiatively as heat (illustrated by the cyan wavy arrow in Figure 1), the excited fluorophore can collide with another molecule to transfer energy in a second type of non-radiative process (for example, quenching, as indicated by the purple wavy arrow in Figure 1), or a phenomenon known as intersystem crossing to the lowest excited triplet state can occur (the blue wavy arrow in Figure 1). The latter event is relatively rare, but ultimately results either in emission of a photon through phosphorescence or a transition back to the excited singlet state that yields delayed fluorescence. Transitions from the triplet excited state to the singlet ground state are forbidden, which results in rate constants for triplet emission that are several orders of magnitude lower than those for fluorescence.
Both of the triplet state transitions are diagrammed on the right-hand side of the Jablonski energy profile illustrated in Figure 1. The low probability of intersystem crossing arises from the fact that molecules must first undergo spin conversion to produce unpaired electrons, an unfavorable process. The primary importance of the triplet state is the high degree of chemical reactivity exhibited by molecules in this state, which often results in photobleaching and the production of damaging free radicals. In biological specimens, dissolved oxygen is a very effective quenching agent for fluorophores in the triplet state. The ground state oxygen molecule, which is normally a triplet, can be excited to a reactive singlet state, leading to reactions that bleach the fluorophore or exhibit a phototoxic effect on living cells. Fluorophores in the triplet state can also react directly with other biological molecules, often resulting in deactivation of both species. Molecules containing heavy atoms, such as the halogens and many transition metals, often facilitate intersystem crossing and are frequently phosphorescent.
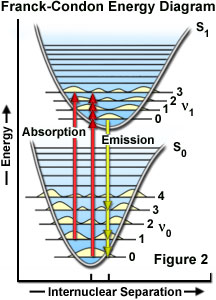
The probability of a transition occurring from the ground state (S(0)) to the excited singlet state (S(1)) depends on the degree of similarity between the vibrational and rotational energy states when an electron resides in the ground state versus those present in the excited state, as outlined in Figure 2. The Franck-Condon energy diagram illustrated in Figure 2 presents the vibrational energy probability distribution among the various levels in the ground (S(0)) and first excited (S(1)) states for a hypothetical molecule. Excitation transitions (red lines) from the ground to the excited state occur in such a short timeframe (femtoseconds) that the internuclear distance associated with the bonding orbitals does not have sufficient time to change, and thus the transitions are represented as vertical lines. This concept is referred to as the Franck-Condon Principle. The wavelength of maximum absorption (red line in the center) represents the most probable internuclear separation in the ground state to an allowed vibrational level in the excited state.
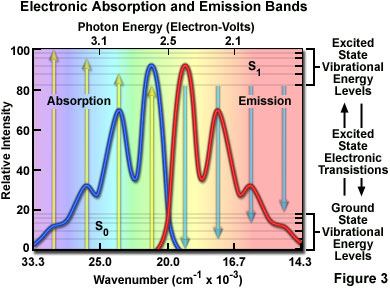
At room temperature, thermal energy is not adequate to significantly populate excited energy states and the most likely state for an electron is the ground state (S(O)), which contains a number of distinct vibrational energy states, each with differing energy levels. The most favored transitions will be the ones where the rotational and vibrational electron density probabilities maximally overlap in both the ground and excited states (see Figure 2). However, incident photons of varying wavelength (and quanta) may have sufficient energy to be absorbed and often produce transitions from other internuclear separation distances and vibrational energy levels. This effect gives rise to an absorption spectrum containing multiple peaks (Figure 3). The wide range of photon energies associated with absorption transitions in fluorophores causes the resulting spectra to appear as broad bands rather than discrete lines.
The hypothetical absorption spectrum illustrated in Figure 3 (blue band) results from several favored electronic transitions from the ground state to the lowest excited energy state (labeled S(0) and S(1), respectively). Superimposed over the absorption spectrum are vertical lines (yellow) representing the transitions from the lowest vibrational level in the ground state to higher vibrational energy levels in the excited state. Note that transitions to the highest excited vibrational levels are those occurring at higher photon energies (lower wavelength or higher wavenumber). The approximate energies associated with the transitions are denoted in electron-volts (eV) along the upper abscissa of Figure 3. Vibrational levels associated with the ground and excited states are also included along the right-hand ordinate.
Scanning through the absorption spectrum of a fluorophore while recording the emission intensity at a single wavelength (usually the wavelength of maximum emission intensity) will generate the excitation spectrum. Likewise, exciting the fluorophore at a single wavelength (again, preferably the wavelength of maximum absorption) while scanning through the emission wavelengths will reveal the emission spectral profile. The excitation and emission spectra may be considered as probability distribution functions that a photon of given quantum energy will be absorbed and ultimately enable the fluorophore to emit a second photon in the form of fluorescence radiation.
Stokes Shift and the Mirror Image Rule
If the fluorescence emission spectrum of a fluorophore is carefully scrutinized, several important features become readily apparent. The emission spectrum is independent of the excitation energy (wavelength) as a consequence of rapid internal conversion from higher initial excited states to the lowest vibrational energy level of the S(1) excited state. For many of the common fluorophores, the vibrational energy level spacing is similar for the ground and excited states, which results in a fluorescence spectrum that strongly resembles the mirror image of the absorption spectrum. This is due to the fact that the same transitions are most favorable for both absorption and emission. Finally, in solution (where fluorophores are generally studied) the detailed vibrational structure is generally lost and the emission spectrum appears as a broad band.
As previously discussed, following photon absorption, an excited fluorophore will quickly undergo relaxation to the lowest vibrational energy level of the excited state. An important consequence of this rapid internal conversion is that all subsequent relaxation pathways (fluorescence, non-radiative relaxation, intersystem crossing, etc.) proceed from the lowest vibrational level of the excited state (S(1)). As with absorption, the probability that an electron in the excited state will return to a particular vibrational energy level in the ground state is proportional to the overlap between the energy levels in the respective states (Figure 2). Return transitions to the ground state (S(0)) usually occur to a higher vibrational level (see Figure 3), which subsequently reaches thermal equilibrium (vibrational relaxation). Because emission of a photon often leaves the fluorophore in a higher vibrational ground state, the emission spectrum is typically a mirror image of the absorption spectrum resulting from the ground to first excited state transition. In effect, the probability of an electron returning to a particular vibrational energy level in the ground state is similar to the probability of that electron's position in the ground state before excitation. This concept, known as the Mirror Image Rule, is illustrated in Figure 3 for the emission transitions (blue lines) from the lowest vibrational energy level of the excited state back to various vibrational levels in ground state. The resulting emission spectrum (red band) is a mirror image of the absorption spectrum displayed by the hypothetical chromophore.
In many cases, excitation by high energy photons leads to the population of higher electronic and vibrational levels (S(2), S(3), etc.), which quickly lose excess energy as the fluorophore relaxes to the lowest vibrational level of the first excited state (see Figure 1). Because of this rapid relaxation process, emission spectra are generally independent of the excitation wavelength (some fluorophores emit from higher energy states, but such activity is rare). For this reason, emission is the mirror image of the ground state to lowest excited state transitions, but not of the entire absorption spectrum, which may include transitions to higher energy levels. An excellent test of the mirror image rule is to examine absorption and emission spectra in a linear plot of the wavenumber (the reciprocal of wavelength or the number of waves per centimeter), which is directly proportional to the frequency and quantum energy. When presented in this manner (see Figure 3), symmetry between extinction coefficients and intensity of the excitation and emission spectra as a function of energy yield mirrored spectra when reciprocal transitions are involved.
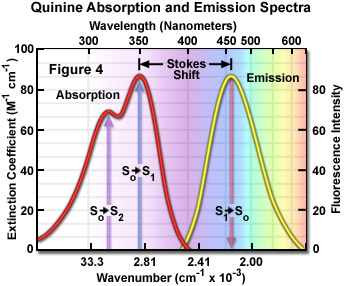
Presented in Figure 4 are the absorption and emission spectra for quinine, the naturally occurring antimalarial agent (and first known fluorophore) whose fluorescent properties were originally described by Sir John Fredrick William Hershel in 1845. Quinine does not adhere to the mirror image rule as is evident by inspecting the single peak in the emission spectrum (at 460 nanometers), which does not mirror the two peaks at 310 and 350 nanometers featured in the bimodal absorption spectrum. The shorter wavelength ultraviolet absorption peak (310 nanometers) is due to an excitation transition to the second excited state (from S(0) to S(2)) that quickly relaxes to the lowest excited state (S(1)). As a consequence, fluorescence emission occurs exclusively from the lowest excited singlet state (S(1)), resulting in a spectrum that mirrors the ground to first excited state transition (350 nanometer peak) in quinine and not the entire absorption spectrum.
Because the energy associated with fluorescence emission transitions (see Figures 1-4) is typically less than that of absorption, the resulting emitted photons have less energy and are shifted to longer wavelengths. This phenomenon is generally known as Stokes Shift and occurs for virtually all fluorophores commonly employed in solution investigations. The primary origin of the Stokes shift is the rapid decay of excited electrons to the lowest vibrational energy level of the S(1) excited state. In addition, fluorescence emission is usually accompanied by transitions to higher vibrational energy levels of the ground state, resulting in further loss of excitation energy to thermal equilibration of the excess vibrational energy. Other events, such as solvent orientation effects, excited-state reactions, complex formation, and resonance energy transfer can also contribute to longer emission wavelengths.
In practice, the Stokes shift is measured as the difference between the maximum wavelengths in the excitation and emission spectra of a particular fluorochrome or fluorophore. The size of the shift varies with molecular structure, but can range from just a few nanometers to over several hundred nanometers. For example, the Stokes shift for fluorescein is approximately 20 nanometers, while the shift for quinine is 110 nanometers (see Figure 4) and that for the porphyrins is over 200 nanometers. The existence of Stokes shift is critical to the extremely high sensitivity of fluorescence imaging measurements. The red emission shift enables the use of precision bandwidth optical filters to effectively block excitation light from reaching the detector so the relatively faint fluorescence signal (having a low number of emitted photons) can be observed against a low-noise background.
Extinction Coefficient, Quantum Yield, and Fluorescence Lifetime
Three fundamental parameters commonly used in describing and comparing fluorophores are the extinction coefficient (ε), quantum yield (Φ), and fluorescence lifetime (τ). Molar extinction coefficients are widely employed in the fields of spectroscopy, microscopy, and fluorescence in order to convert units of absorbance into units of molar concentration for a variety of chemical substances. The extinction coefficient is determined by measuring the absorbance at a reference wavelength (characteristic of the absorbing molecule) for a one molar (M) concentration (one mole per liter) of the target chemical in a cuvette having a one-centimeter path length. The reference wavelength is usually the wavelength of maximum absorption in the ultraviolet or visible light spectrum. Extinction coefficients are a direct measure of the ability of a fluorophore to absorb light, and those chromophores having a high extinction coefficient also have a high probability of fluorescence emission. Also, because the intrinsic lifetime (discussed below) of a fluorophore is inversely proportional to the extinction coefficient, molecules exhibiting a high extinction coefficient have an excited state with a short intrinsic lifetime.
Quantum yield (sometimes incorrectly termed quantum efficiency) is a gauge for measuring the efficiency of fluorescence emission relative to all of the possible pathways for relaxation and is generally expressed as the (dimensionless) ratio of photons emitted to the number of photons absorbed. In other words, the quantum yield represents the probability that a given excited fluorochrome will produce an emitted photon (fluorescence). Quantum yields typically range between a value of zero and one, and fluorescent molecules commonly employed as probes in microscopy have quantum yields ranging from very low (0.05 or less) to almost unity (the brightest fluorophores). In general, a high quantum yield is desirable in most imaging applications. The quantum yield of a given fluorophore varies, sometimes to large extremes, with environmental factors such as pH, concentration, and solvent polarity.
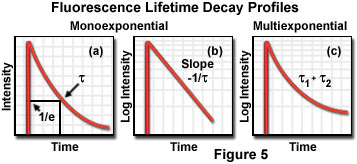
The fluorescence lifetime is the characteristic time that a molecule remains in an excited state prior to returning to the ground state and is an indicator of the time available for information to be gathered from the emission profile. During the excited state lifetime, a fluorophore can undergo conformational changes as well as interact with other molecules and diffuse through the local environment. The decay of fluorescence intensity as a function of time in a uniform population of molecules excited with a brief pulse of light is described by an exponential function:
I(t) = Io • e(-t/τ)
where I(t) is the fluorescence intensity measured at time t, I(o) is the initial intensity observed immediately after excitation, and τ is the fluorescence lifetime. Formally, the fluorescence lifetime is defined as the time in which the initial fluorescence intensity of a fluorophore decays to 1/e (approximately 37 percent) of the initial intensity (see Figure 5(a)). This quantity is the reciprocal of the rate constant for fluorescence decay from the excited state to the ground state.
Because the level of fluorescence is directly proportional to the number of molecules in the excited singlet state, lifetime measurements can be conducted by measuring fluorescence decay after a brief pulse of excitation. In a uniform solvent, fluorescence decay is usually a monoexponential function, as illustrated by the plots of fluorescence intensity as a function of time in Figures 5(a) and 5(b). More complex systems, such as viable tissues and living cells, contain a mixed set of environments that often yield multiexponential values (Figure 5(c)) when fluorescence decay is measured. In addition, several other processes can compete with fluorescence emission for return of excited state electrons to the ground state, including internal conversion, phosphorescence (intersystem crossing), and quenching. Aside from fluorescence and phosphorescence, non-radiative processes are the primary mechanism responsible for relaxation of excited state electrons.
All non-fluorescent processes that compete for deactivation of excited state electrons can be conveniently combined into a single rate constant, termed the non-radiative rate constant and denoted by the variable k(nr). The non-radiative rate constant usually ignores any contribution from vibrational relaxation because the rapid speeds (picoseconds) of these conversions are several orders of magnitude faster than slower deactivation (nanoseconds) transitions. Thus, the quantum yield can now be expressed in terms of rate constants:
Φ = photons emitted/photons absorbed = kf/(kf + knf) = τf/τo
where k(f) is the rate constant for fluorescence decay (the symbol Γ is also used to designate this rate constant). The reciprocal of the decay rate constant equals the intrinsic lifetime (τ(o)), which is defined as the lifetime of the excited state in the absence of all processes that compete for excited state deactivation. In practice, the fluorescence excited state lifetime is shortened by non-radiative processes, resulting in a measured lifetime (τ(f)) that is a combination of the intrinsic lifetime and competing non-fluorescent relaxation mechanisms. Because the measured lifetime is always less than the intrinsic lifetime, the quantum yield never exceeds a value of unity.
Many of the common probes employed in optical microscopy have fluorescence lifetimes measured in nanoseconds, but these can vary over a wide range depending on molecular structure, the solvent, and environmental conditions. Quantitative fluorescence lifetime measurements enable investigators to distinguish between fluorophores that have similar spectral characteristics but different lifetimes, and can also yield clues to the local environment. Specifically, the pH and concentration of ions in the vicinity of the probe can be determined without knowing the localized fluorophore concentration, which is of significant benefit when used with living cells and tissues where the probe concentration may not be uniform. In addition, lifetime measurements are less sensitive to photobleaching artifacts than are intensity measurements.
Quenching and Photobleaching
The consequences of quenching and photobleaching are an effective reduction in the amount of emission and should be of primary consideration when designing and executing fluorescence investigations. The two phenomena are distinct in that quenching is often reversible whereas photobleaching is not. Quenching arises from a variety of competing processes that induce non-radiative relaxation (without photon emission) of excited state electrons to the ground state, which may be either intramolecular or intermolecular in nature. Because non-radiative transition pathways compete with the fluorescence relaxation, they usually dramatically lower or, in some cases, completely eliminate emission. Most quenching processes act to reduce the excited state lifetime and the quantum yield of the affected fluorophore.
A common example of quenching is observed with the collision of an excited state fluorophore and another (non-fluorescent) molecule in solution, resulting in deactivation of the fluorophore and return to the ground state. In most cases, neither of the molecules is chemically altered in the collisional quenching process. A wide variety of simple elements and compounds behave as collisional quenching agents, including oxygen, halogens, amines, and many electron-deficient organic molecules. Collisional quenching can reveal the presence of localized quencher molecules or moieties, which via diffusion or conformational change, may collide with the fluorophore during the excited state lifetime. The mechanisms for collisional quenching include electron transfer, spin-orbit coupling, and intersystem crossing to the excited triplet state. Other terms that are often utilized interchangeably with collisional quenching are internal conversion and dynamic quenching.
A second type of quenching mechanism, termed static or complex quenching, arises from non-fluorescent complexes formed between the quencher and fluorophore that serve to limit absorption by reducing the population of active, excitable molecules. This effect occurs when the fluorescent species forms a reversible complex with the quencher molecule in the ground state, and does not rely on diffusion or molecular collisions. In static quenching, fluorescence emission is reduced without altering the excited state lifetime. A fluorophore in the excited state can also be quenched by a dipolar resonance energy transfer mechanism when in close proximity with an acceptor molecule to which the excited state energy can be transferred non-radiatively. In some cases, quenching can occur through non-molecular mechanisms, such as attenuation of incident light by an absorbing species (including the chromophore itself).
In contrast to quenching, photobleaching (also termed fading) occurs when a fluorophore permanently loses the ability to fluoresce due to photon-induced chemical damage and covalent modification. Upon transition from an excited singlet state to the excited triplet state, fluorophores may interact with another molecule to produce irreversible covalent modifications. The triplet state is relatively long-lived with respect to the singlet state, thus allowing excited molecules a much longer timeframe to undergo chemical reactions with components in the environment. The average number of excitation and emission cycles that occur for a particular fluorophore before photobleaching is dependent upon the molecular structure and the local environment. Some fluorophores bleach quickly after emitting only a few photons, while others that are more robust can undergo thousands or millions of cycles before bleaching.
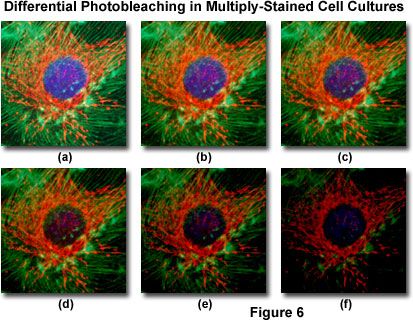
Presented in Figure 6 is a typical example of photobleaching (fading) observed in a series of digital images captured at different time points for a multiply-stained culture of bovine pulmonary artery epithelial cells. The nuclei were stained with 4,6-diamidino-2-phenylindole (DAPI; blue fluorescence), while the mitochondria and actin cytoskeleton were stained with MitoTracker Red (red fluorescence) and a phalloidin derivative (green fluorescence), respectively. Time points were taken in two-minute intervals using a fluorescence filter combination with bandwidths tuned to excite the three fluorophores simultaneously while also recording the combined emission signals. Note that all three fluorophores have a relatively high intensity in Figure 6(a), but the DAPI (blue) intensity starts to drop rapidly at two minutes and is almost completely gone at six minutes. The mitochondrial and actin stains are more resistant to photobleaching, but the intensity of both drops over the course of the timed sequence (10 minutes).
An important class of photobleaching events are photodynamic, meaning they involve the interaction of the fluorophore with a combination of light and oxygen. Reactions between fluorophores and molecular oxygen permanently destroy fluorescence and yield a free radical singlet oxygen species that can chemically modify other molecules in living cells. The amount of photobleaching due to photodynamic events is a function of the molecular oxygen concentration and the proximal distance between the fluorophore, oxygen molecules, and other cellular components. Photobleaching can be reduced by limiting the exposure time of fluorophores to illumination or by lowering the excitation energy. However, these techniques also reduce the measurable fluorescence signal. In many cases, solutions of fluorophores or cell suspensions can be deoxygenated, but this is not feasible for living cells and tissues. Perhaps the best protection against photobleaching is to limit exposure of the fluorochrome to intense illumination (using neutral density filters) coupled with the judicious use of commercially available antifade reagents that can be added to the mounting solution or cell culture medium.
Under certain circumstances, the photobleaching effect can also be utilized to obtain specific information that would not otherwise be available. For example, in fluorescence recovery after photobleaching (FRAP) experiments, fluorophores within a target region are intentionally bleached with excessive levels of irradiation. As new fluorophore molecules diffuse into the bleached region of the specimen (recovery), the fluorescence emission intensity is monitored to determine the lateral diffusion rates of the target fluorophore. In this manner, the translational mobility of fluorescently labeled molecules can be ascertained within a very small (2 to 5 micrometer) region of a single cell or section of living tissue.
Solvent Effects on Fluorescence Emission
A variety of environmental factors affect fluorescence emission, including interactions between the fluorophore and surrounding solvent molecules (dictated by solvent polarity), other dissolved inorganic and organic compounds, temperature, pH, and the localized concentration of the fluorescent species. The effects of these parameters vary widely from one fluorophore to another, but the absorption and emission spectra, as well as quantum yields, can be heavily influenced by environmental variables. In fact, the high degree of sensitivity in fluorescence is primarily due to interactions that occur in the local environment during the excited state lifetime. A fluorophore can be considered an entirely different molecule in the excited state (than in the ground state), and thus will display an alternate set of properties in regard to interactions with the environment in the excited state relative to the ground state.
In solution, solvent molecules surrounding the ground state fluorophore also have dipole moments that can interact with the dipole moment of the fluorophore to yield an ordered distribution of solvent molecules around the fluorophore. Energy level differences between the ground and excited states in the fluorophore produce a change in the molecular dipole moment, which ultimately induces a rearrangement of surrounding solvent molecules. However, the Franck-Condon principle dictates that, upon excitation of a fluorophore, the molecule is excited to a higher electronic energy level in a far shorter timeframe than it takes for the fluorophore and solvent molecules to re-orient themselves within the solvent-solute interactive environment. As a result, there is a time delay between the excitation event and the re-ordering of solvent molecules around the solvated fluorophore (as illustrated in Figure 7), which generally has a much larger dipole moment in the excited state than in the ground state.
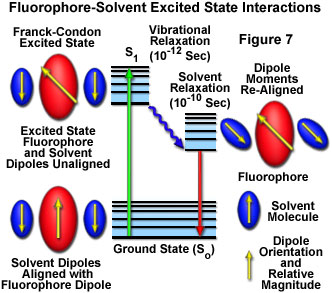
After the fluorophore has been excited to higher vibrational levels of the first excited singlet state (S(1)), excess vibrational energy is rapidly lost to surrounding solvent molecules as the fluorophore slowly relaxes to the lowest vibrational energy level (occurring in the picosecond time scale). Solvent molecules assist in stabilizing and further lowering the energy level of the excited state by re-orienting (termed solvent relaxation) around the excited fluorophore in a slower process that requires between 10 and 100 picoseconds. This has the effect of reducing the energy separation between the ground and excited states, which results in a red shift (to longer wavelengths) of the fluorescence emission. Increasing the solvent polarity produces a correspondingly larger reduction in the energy level of the excited state, while decreasing the solvent polarity reduces the solvent effect on the excited state energy level. The polarity of the fluorophore also determines the sensitivity of the excited state to solvent effects. Polar and charged fluorophores exhibit a far stronger effect than non-polar fluorophores.
Solvent relaxation effects on fluorescence can result in a dramatic effect on the size of Stokes shifts. For example, the heterocyclic indole moiety of the amino acid tryptophan normally resides on the hydrophobic interior of proteins where the relative polarity of the surrounding medium is low. Upon denaturation of a typical host protein with heat or a chemical agent, the environment of the tryptophan residue is changed from non-polar to highly polar as the indole ring emerges into the surrounding aqueous solution. Fluorescence emission is increased in wavelength from approximately 330 to 365 nanometers, a 35-nanometer shift due to solvent effects. Thus, the emission spectra of both intrinsic and extrinsic fluorescent probes can be employed to probe solvent polarity effects, molecular associations, and complex formation with polar and non-polar small molecules and macromolecules.
Quantitative fluorescence investigations should be constantly monitored to scan for potential shifts in emission profiles, even when they are not intended nor expected. In simple systems where a homogeneous concentration can be established, a progressive emission intensity increase should be observed as a function of increasing fluorophore concentration, and vice versa. However, in complex biological systems, fluorescent probe concentration may vary locally over a wide range, and intensity fluctuations or spectral shifts are often the result of changes in pH, calcium ion concentration, energy transfer, or the presence of a quenching agent rather than fluorophore stoichiometry. The possibility of unexpected solvent or other environmental effects should always be considered in evaluating the results of experimental procedures.
Fluorescence Anisotropy
Fluorescence emission from a wide variety of specimens becomes polarized when the intrinsic or extrinsic fluorophores are excited with plane-polarized light. The level of polarized emission is described in terms of the anisotropy, and specimens that display some degree of anisotropy also exhibit a detectable level of polarized emission. Observation and measurement of fluorescence anisotropy is based on the photoselective excitation of fluorophores due to the transient alignment of the absorption dipole moment with an oriented electric field vector of illuminating photons (polarized light). When a fluorophore absorbs an incident photon, the excitation event arises from an interaction between the oscillating electric field component of the incoming radiation and the transition dipole moment created by the electronic state of the fluorophore molecular orbitals. Fluorophores preferentially absorb those photons that have an electric field vector aligned parallel to the absorption transition dipole moment of the fluorophore.
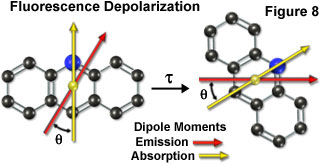
Fluorescence emission also occurs in a plane defined by the direction of the emission transition dipole moment. Each fluorophore has fixed within its molecular framework an absorption and emission transition dipole moment (Figure 8), which have defined orientations with respect to the molecular axes of the dye molecule and are separated from each other by an angle (θ). Presented in Figure 8 is a hypothetical tri-nuclear aromatic heterocyclic fluorophore (arranged similar to the acridine ring system) overlaid with arrows representing the spatial relationship of the absorption (yellow arrow) and emission (red arrow) transition dipole moment vectors. During the excited state lifetime (τ), rotation of the fluorophore will depolarize its emission with respect to the excitation vector, resulting in a mechanism with which to measure the rigidity of the environment containing the fluorophore.
Illumination of an isotropic solution containing randomly oriented fluorophores with plane-polarized light will preferentially excite only those molecules whose absorption transition dipole moments are aligned parallel (or nearly so) to the polarization electric vector plane. The probability of absorption is actually proportional to the cosine squared of the angle between the dipole and the electric field vector of the incident light (absorption is maximum when the angle is zero degrees and reaches a minimum as the angle approaches 90 degrees). The result will be a specific photoselection process of a sub-population of excited fluorophores from the original ensemble, yielding excited state fluorophores oriented parallel to a specific axis. Fluorescence emission from this subpopulation will also be partially polarized. Measurements of the relative angle between the excitation and emission transition dipole moments determines the degree of polarization (p) or anisotropy (r), as given by the equations:
p = (I|| - I⊥)/(I|| + I⊥) and r = (I|| - I⊥)/(I|| + 2I⊥)
where I(||) is the fluorescence emission measured in the plane parallel to the plane of excitation and I(⊥) is the fluorescence emission measured in the plane perpendicular to the plane of excitation. In practice, the amount of polarized light is calculated by measuring the emission collected with a polarizer placed in the excitation light path and an analyzer placed in the emission light path that is oriented either parallel or perpendicular to the excitation polarizer (see Figure 9). Anisotropy and polarization are both expressions for the same phenomenon and the values can be easily interconverted. In most cases, the anisotropy expression is preferred because the associated mathematical equations are simpler when expressed in terms of this parameter.
Because the emission transition dipole moment is displaced from the excitation transition moment due to spatial orientation (see Figure 8), some degree of depolarization will occur even if the fluorophores are fixed in place. Thus, the absorption process itself is the first source of fluorescence depolarization. Rotational motion of the fluorophore, which invariably occurs during the lifetime of the excited state, results in additional displacement of the emission transition dipole from the original orientation, and will further lower the observed emission anisotropy. The rate of rotation is dependent both on the size of the fluorophore (or the macromolecule to which it is bound) and the viscosity of its localized environment. The fluorescence anisotropy of a solution can be related to the rotational mobility of the fluorophore by the Perrin equation:
r0/r = 1 + (RTτ)/(ηV)
where r(0) is the limiting anisotropy (the anisotropy observed in the absence of any fluorophore rotation), r is the measured anisotropy, η is the viscosity of the environment, V is the volume of the rotating molecule, R is the universal gas constant, T is the temperature of the solution on the Kelvin scale, and τ is the lifetime of the fluorophore excited state. In practice, the Perrin equation is reduced to express the time-dependent decay of anisotropy in terms of the rotational correlation time (Φ) of the fluorophore:
r0/r = 1 + τ/Φ where Φ = (ηV)/(RT)
Among the phenomena that lead to (lower) measured fluorescence anisotropy values that depart from the maximum theoretical limit is the natural rotational diffusion of molecules that occurs during the lifetime of the excited state. In solution, small molecular weight fluorophores (up to several thousand Daltons) have a rotational correlation time ranging between 50 and 100 picoseconds, which is significantly faster than the rate of emission and displaces, or randomly distributes, the emission transition dipole moment. Because the average excited state lifetime of a typical fluorophore is in the nanosecond range, the molecules are able to rotate numerous times before emission. As a result, the polarized emission is randomized so that the net anisotropy is zero. A second (but far more rare) mechanism for commonly observed decreases in anisotropy is transfer of excitation energy between fluorophores.
Association of a fluorophore with a much larger macromolecule results in a dramatic increase in the rotational correlation time. In most cases, the correlation time for a large protein in solution ranges from 10 to 50 nanoseconds, which equals or exceeds the average excited state lifetime of a typical fluorophore. Binding of the fluorophore slows the rotational motion of the fluorescent probe and enables the investigation of the rotational correlation time of the host protein. Smaller proteins usually display much shorter correlational times than larger proteins, or proteins involved in complex biological assemblies, and can be expected to produce lower anisotropies.
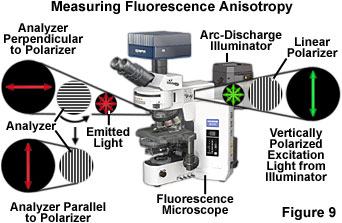
The instrumental approach for measuring fluorescence polarization with an optical microscope is presented in Figure 9. Plane-polarized excitation light is generated by passing light from the arc-discharge illuminator through a linear polarizer. The plane-polarized excitation light is absorbed maximally by fluorophores in the specimen (on the microscope slide) whose absorption dipole moments are oriented parallel to the plane of the excitation light. This results in a specific sub-population of fluorophores being excited (an anisotropic collection of fluorophores). In theory, all of the excited fluorophores possess the same orientation of absorption and emission dipole moments. The fluorescence subsequently emitted by the fluorophore is measured in both parallel and perpendicular orientations with respect to the polarization plane of the excitation illumination. As the fluorophore rotates during its excited state lifetime, the level of emission observed parallel to the plane of excitation will continually decrease, while the amount of emission recorded perpendicular to the plane of excitation will simultaneously increase.
As discussed above, fluorescence anisotropy measurements can provide information on the rotational mobility of proteins, from which their molecular weight and shape can be inferred. In addition, intermolecular associations can be monitored, as well as conformational changes and protein denaturation. The technique has also been employed to examine the internal flexibility of proteins and a number of physical properties of biological membranes, including viscosity, phase transitions, chemical composition, and the effects of membrane perturbation on these properties. Fluorescence anisotropy measurements can be made on steady-state systems using continuous illumination or in time-resolved experiments that utilize pulsed excitation events.
Resonance Energy Transfer
A fluorophore in the excited state can, as discussed above, lose excitation energy by converting it into light (fluorescence), through thermal equilibration (vibrational relaxation), or by transfer to another molecule through collision or complex formation (non-radiative dissipation and quenching). In forming a complex or colliding with a solvent molecule, energy is transferred by the coupling of electronic orbitals between the fluorophore and a second molecule. There is also yet another process, termed resonance energy transfer (RET), by which a fluorophore in the excited state (termed the donor) may transfer its excitation energy to a neighboring chromophore (the acceptor) non-radiatively through long range dipole-dipole interactions over distances measured in nanometers. The basic theory of resonance energy transfer assumes the donor fluorophore can be treated as an oscillating dipole that can transfer energy to a similar dipole at a particular resonance frequency in a manner analogous to the behavior of coupled oscillators, such as a pair of tuning forks vibrating at the same frequency.
Resonance energy transfer is potentially possible whenever the emission spectrum of the donor fluorophore overlaps the absorption spectrum of the acceptor, which by itself is not necessarily fluorescent. An important concept in understanding this mechanism of energy transfer is that the process does not involve emission of light from the donor followed by subsequent absorption of the emitted photons by the acceptor. In other words, there is no intermediate photon involved in the mechanism of resonance energy transfer. The transfer of energy is manifested by both quenching of the donor fluorescence emission in the presence of the acceptor and increased (sensitized) emission of acceptor fluorescence.
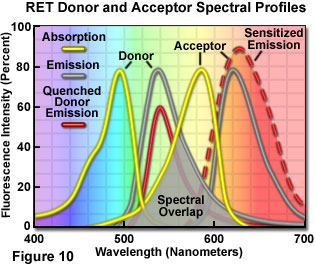
Presented in Figure 10 are changes to the emission intensities of the spectral profiles from a coupled donor and acceptor molecule undergoing resonance energy transfer. Overlap (gray area) between the donor emission (central gray curve) and acceptor absorption spectra (central yellow curve) is required for the process to occur. When this overlap is present, and the donor and acceptor are separated by less than 10 nanometers, donor excitation energy can be transferred non-radiatively to the acceptor. The net result is quenching of the donor fluorescence emission (red curve) and an increase in the emission intensity of the acceptor (sensitized emission, red dashed curve). The individual spectral profiles for the donor and acceptor in Figure 10 can be identified using the legend in the upper left-hand corner of the figure.
The efficiency of resonance energy transfer varies with the degree of spectral overlap, but most importantly as the inverse of the sixth power of the distance (radius, r) separating the donor and acceptor chromophores. Energy transfer to the acceptor requires the distance between the chromophores to be relatively close, within the limiting boundaries of 1 to 10 nanometers. The phenomenon can be detected by exciting a labeled specimen with illumination wavelengths corresponding to the absorption (excitation) maximum of the donor and detecting fluorescence emission in the peak emission wavelength region of the acceptor. Alternatively, the fluorescence lifetime of the donor can be measured in the presence and absence of the acceptor. The dependence of energy transfer efficiency on the separation distance between the donor and acceptor provides the basis for the utility of resonance energy transfer in the study of cell biology. This facet of resonance energy transfer enables the technique to be used as a spectroscopic ruler to study and quantify interactions between cellular components, as well as conformational changes within individual macromolecules, at the molecular level.
A set of specific conditions must be established for resonance energy transfer to occur. The donor chromophore must be capable of fluorescence with a reasonable quantum yield coupled to a sufficiently long lifetime, and the distance between the donor and acceptor molecules must be relatively short (in most cases, only a couple of nanometers). In addition, as discussed above, the design of resonance energy transfer investigations does not involve considering the actual reabsorption of light by the acceptor. The rate of energy transfer (K(T)) and energy transfer efficiency (E(T)) are both related to the lifetime of the donor in the presence or absence of the acceptor. The rate constant for energy transfer is expressed as:
KT = (1/τD) • (R0/r)6
where R(0) is the critical Förster distance, which is the donor-acceptor separation radius where the probability of energy transfer equals that of the donor de-excitation (decay) rate in the absence of the acceptor. Thus, the Förster distance, typically ranging between 2 and 7 nanometers for most resonance energy transfer measurements, is the distance between chromophores at which energy transfer is 50-percent efficient. Also in the equation, τ(D) is the variable used to denote the lifetime of the donor in the absence of the acceptor, and r is the distance separating the donor and acceptor molecules. By examining the equation, it is clear that the resonance energy transfer rate is equal to the donor decay rate (reciprocal of the lifetime) in the absence of the acceptor when the radius between chromophores is equal to the Förster distance. At this point, the transfer efficiency is 50 percent and the donor emission would be decreased to one-half of the normal intensity in the absence of the acceptor. Because the rate of energy transfer is inversely proportional to the sixth power of the separation distance, the proximity between donor and acceptor is clearly the dominating term. The critical Förster distance, expressed in nanometers, is calculated according to the equation:
R0 = 2.11 × 10⁻² • [η-4Q0κ2J(λ)]1/6
The Förster distance equation introduces the concept of κ2 (κ-squared), which is an orientation factor describing the spatial relationship between the donor and acceptor absorption and emission dipoles in three-dimensional space. If dipole orientation is random between the two chromophores (due to rapid rotation of the donor and acceptor molecules), the orientation factor is taken to equal the statistical average (a value of 2/3 or 0.67) for most calculations of R(0). The refractive index of the medium where energy transfer occurs is denoted by the variable η, and Q(0) is the quantum yield of the donor in the absence of the acceptor. The overlap integral, J(λ), defines the area of overlap between the donor emission and acceptor absorption spectra (illustrated by the gray-shaded area in Figure 10). Energy transfer efficiency (E(T)) is related to the distance separating the donor and acceptor (r) by the equation:
r = R0[(1/ET) - 1]1/6 where ET = 1 - (τDA/τD)
Thus, by measuring the fluorescence lifetime of the donor in the presence of the acceptor (τ(DA)) and without the acceptor (τ(D)), the energy transfer efficiency and distance separating the two chromophores can be determined. Because the efficiency of resonance energy transfer is heavily influenced by diffusion of the donor and acceptor during the donor lifetime, time-resolved measurements are most suitable for analysis of spatially fluctuating systems. Transfer efficiency can also be measured by steady-state techniques using the relative fluorescence emission intensity of the donor in the presence and absence of the acceptor. However, these calculations are limited to situations where the donor and acceptor are separated by a fixed distance, such as when both chromophores are bound to the same macromolecule. This is not the case for donors and acceptors bound to different proteins or a protein and nucleic acid, where time-resolved information is often necessary. Likewise, for a mixture of chromophores in solution, or dispersed randomly in membranes, more complex calculations that take into consideration an average transfer rate of spatially distributed molecules are necessary.
Resonance energy transfer investigations provide unique information when compared to that derived from alternative experiments involving fluorescence anisotropy, solvent relaxation, quenching, or most excited state reactions. A majority of quantitative fluorescence measurements rely on short-range interactions between the fluorophore and other molecules in the immediate vicinity, including the surrounding solvent molecules. In contrast, solvent effects and even the presence of a large macromolecule (such as a protein or nucleic acid) have little effect on the efficiency of energy transfer between the donor and acceptor. The primary factor for consideration in measuring resonance energy transfer, unlike other techniques, is the actual physical distance between the donor and acceptor molecules.
Conclusions
Even though the fluorescence phenomenon appears to be almost instantaneous, with current instrumentation the relatively long timeframe between absorption of a photon and the emission of a second photon by a fluorophore opens the door to a considerable number of investigations using this remarkable methodology. Included in the palette of fluorescence techniques are observable changes in absorption and emission spectra, quantum yield, lifetimes, quenching, photobleaching, anisotropy, energy transfer, solvent effects, diffusion, complex formation, and a host of environmental variables. All of these factors can be readily evaluated through steady state or time-resolved interpretations of the spectral properties of intrinsic and extrinsic fluorophores.
When coupled to the optical microscope, fluorescence enables investigators to study a wide spectrum of phenomena in cellular biology. Foremost is the analysis of intracellular distribution of specific macromolecules in sub-cellular assemblies, such as the nucleus, membranes, cytoskeletal filaments, mitochondria, Golgi apparatus, and endoplasmic reticulum. In addition to steady state observations of cellular anatomy, fluorescence is also useful to probe intracellular dynamics and the interactions between various macromolecules, including diffusion, binding constants, enzymatic reaction rates, and a variety of reaction mechanisms, in time-resolved measurements. Other important processes are also targets for investigation using the high degree of specificity and spatial resolution available with fluorescence microscopy. For example, fluorescent probes have been employed to monitor intracellular pH and the localized concentration of important ions, and for the study of cell viability and the factors that influence the rate of apoptosis. Likewise, important cellular functions such as endocytosis, exocytosis, signal transduction, and transmembrane potential generation have come under study with fluorescence microscopy. In reviewing the large number of applications that benefit from fluorescence analysis, it is apparent why the significant utility of fluorescence microscopy has driven this technique to the forefront of biomedical research.
このページはお住まいの地域ではご覧いただくことはできません。