Optical images produced in the microscope can be captured using either traditional film techniques, digitally with electronic detectors such as a charge-coupled device (CCD), or with a tube-type video camera. When a dynamic event must be recorded in real time, a video camera is often the most suitable resource for the task.
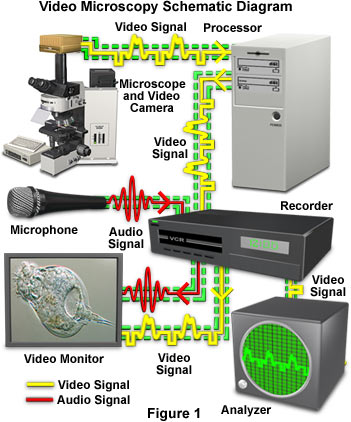
The primary function of video is to produce an electrical signal by scanning an optical image of a dynamic scene, then transmitting a faithful reproduction of the information in real time to a receiver housed in a remote location for viewing or recording of the original event. Important features and components of video microscopy are diagrammed in Figure 1. An optical event is first captured in the microscope and translated into an electrical video signal by an electronic camera attached to the trinocular tube. The signal may be either processed or recorded, then sent to an analyzer or converted back into a two-dimensional image on a video monitor (Figure 1) in real time. Addition of an audio signal to the video information (by recording sound on a VCR or similar device) allows concurrent annotation of comments that often captures otherwise irretrievable information.
Among the important features of video to be considered are the fact that the optical image is generally a dynamic (as opposed to static) two-dimensional array, which must be transmitted over some distance utilizing a single channel or cable. Either before or after transmission, the video signal may be processed or stored prior to being displayed on a monitor that must immediately and faithfully follow the original scene in real time. The widespread appeal of broadcast and cable television (and other video applications) has led to the development of an ingenious series of electro-optical and electronic devices, which have been of great benefit to video microscopy.
In video microscopy, the signal is usually transmitted over very short distances through coaxial cables rather than broadcast through a wireless system. This configuration is referred to as closed-circuit TV (CCTV), which shares much in common with wireless or broadcast TV, with some deviation in standards and convention.
Video Signal Generation
The conversion of a two-dimensional image captured through a microscope into a recoverable train of electrical impulses is accomplished by sequentially scanning narrow strips of the optical image. In principle, the microscope image can be scanned by any electro-optical detector that is capable of rapidly converting light intensity into an electrical voltage or current. Many of the characteristics of video signals can be understood by display of the scanned electrical signal on a suitable oscilloscope.
Figure 2 illustrates the relationship between individual scan lines from an optical image and the resulting video signal. The specimen is a live rotifer imaged using differential interference contrast (DIC) microscopy. Sequential scanning of the rotifer image occurs from left to right (for example: A to A' then B to B', etc.) and incrementally downward starting at the upper left-hand corner of the image and finishing at the lower right. As each horizontal trace is scanned, it produces an electrical signal relating image brightness to a corresponding value measured in volts (the video signal).
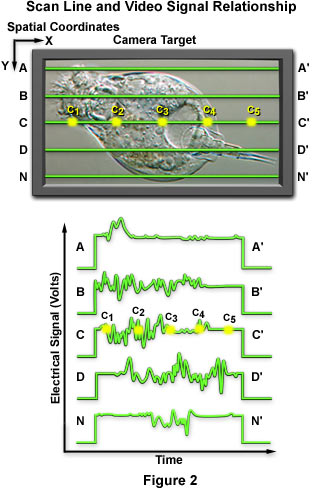
The graph presented in the lower portion of Figure 2 shows a plot of the electrical signal generated by scanning specific areas of the image versus time. The location of a specific area on the image, such as C(1) or C(2), corresponds to its point in time in the video signal (c(1) or c(2)). Although only five scan lines are illustrated in Figure 2, the entire image is actually scanned. Because the amplitude of the electrical signal is proportional to the brightness of the image being scanned, the current or voltage at a particular point in the signal corresponds to light intensity of the image at that point (voltage c(1) corresponds to intensity C(1)). The narrow horizontal strip in the image represented by the C horizontal scan line is scanned at constant speed so that the distances C-C(1), C-C(2) and C-C(3) in the scanned image are proportional to the time intervals c-c(1), c-c(2), and c-c(3) in the electrical signal. The result is a signal from a single horizontal scan line that is a faithful, time-dependent, electrical representation of the corresponding narrow strip in the optical image.
Video Signal Generation
Discover how a video signal is produced by sequential scanning of an image to produce a train of electrical impulses.
In order to construct a complete two-dimensional image, video scan lines must cover the entire image area, and the resulting electrical signal must contain the voltage amplitude distribution of all points on all of the scan lines. The electrical signal output from scan lines is formatted serially (in sequence) as a single linear signal rather than an array of parallel signals. This means that each individual scan line (A-A', B-B', etc.) is added to the sequence to produce a single linear stream of electrical pulses that can be conveyed along a single coaxial cable or transmitted (broadcast) by electromagnetic waves through the atmosphere on a single channel.
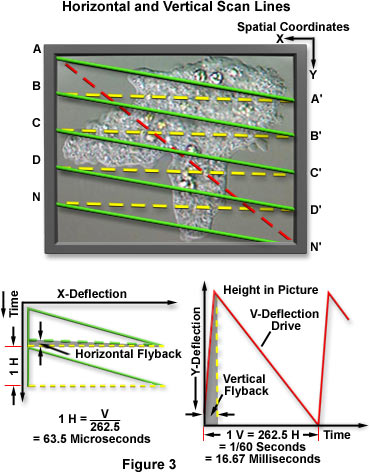
As mentioned above, a two-dimensional optical image is transformed into a series of electrical pulses to produce a video signal. Standard convention dictates that the image is scanned as "seen on the video monitor" from the upper left to the right, and then repeated on the next line down, similar to reading English text. Starting with the upper left-hand corner (as illustrated in Figures 2 and 3), the image is first scanned horizontally along line A-A' from left to right. Upon reaching point A', the scanning spot is made to "fly back" to the beginning of the next scan line positioned at point B. The flyback (or retrace) operation occurs much faster than the scan speed, and the video signal is blanked during the flyback to prevent trace A'-B (Figure 3; dashed yellow line) from contributing to the signal. After completing the loop, the scan continues, at the standard horizontal scanning velocity, along trace B-B' until it again flies back from B' to C. This cycle is continued until all areas of the image have been sequentially scanned.
The horizontal scan (H) lines are not actually horizontal, but instead slant downward slightly to the right by a vertical distance that is equal to the width of an individual scan line. In this sense, the scanning spot is also undergoing a vertical scan (V), moving downward at a slower but constant speed. At the end of the scan sequence when the last horizontal scan (N-N') has been completed, the scanning spot flies back from N' at the lower right-hand corner to point A in the upper left. After the vertical flyback, the process starts over again to ultimately yield the video raster.
At the upper left-hand position of the video screen, the spatial coordinates of the image are given a value of zero on both the horizontal (or X) and vertical (or Y) axis. The X axis increases in value from left to right, whereas the Y axis increases in value as the scan travels from top to bottom (downward). In this convention, identical to the one utilized for computer monitors, the Y-axis direction is reversed from the standard Cartesian coordinate system. Thus, the coordinate set for the starting point of the scan (A in Figures 2-4) is X = 0 and Y = 0, or (0,0).
Horizontal and vertical movements of the image scanning beams in a vidicon camera and monitor are generated by either magnetic or electrostatic deflectors, which provide the constant-velocity scans needed to drive the horizontal scan lines, vertical deflection, and rapid flybacks. Resulting waveforms generated by the deflectors are sawtooth patterns, as can be readily seen when these signals are viewed on an oscilloscope. The exact shape of the sawtooth wave is extremely important to image integrity, because the slope of the wave governs the velocity of scanning. In situations where a portion of the sawtooth wave is not exactly linear, but instead slightly curved, or when the slope is not constant, the resulting video image is distorted by the amount of the sawtooth wave deviation. The frequencies of each horizontal and vertical sawtooth wave determine the scanning rates in the H and V direction. Scanning frequencies for the H scan are much higher, producing faster rates and repeats that occur many times during a single vertical (V) scan.
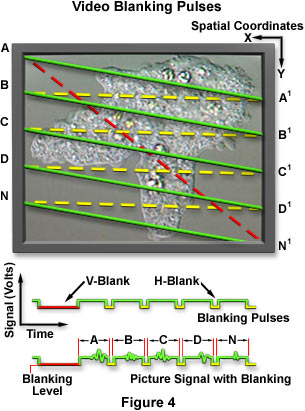
During flybacks, the signal voltage of retraces is lowered to a blanking level, essentially turning off the scanning electron beam, to avoid adding extra lines that would degrade the image. These blanking pulses actually start a very short time before the H and V flybacks to ensure that blanking is complete, as illustrated in Figure 4.
The previous discussion of electronics involved in the generation of the video signal applies to vidicon and similar vacuum-tube cameras. Solid state cameras, such as charge-coupled devices (CCDs) and active pixel sensor CMOS imagers, and display devices utilize arrays of fixed picture elements (termed pixels) to capture and display images. Although the detector and display are scanned in a different manner with solid state devices, the video signal is identical to that produced by tube-type cameras.
Standard Scanning Rates
Standard broadcast format, adapted by both North American countries and the Japanese, produces 525 horizontal scan lines at a repeat of 30 times each second for each image. In the European and British format, images are scanned with 625 horizontal lines with a repeat of 25 times per second. To avoid confusion, the North American standard is referred to as the 525/60 scan rate and the European standard is the 625/50 scan rate. Discussions in this section assume a video scan rate of 525/60, the North American standard.
Flicker is an annoying artifact that occurs when an image is presented to the eye intermittently at several frames per second. In a video scene that has a moderate amount of luminance, flicker becomes reasonably unobtrusive, and the critical flicker frequency is reached at a refresh rate between 40 and 60 Hertz (Hz, or cycles per second). Flicker is the sensation of light fluttering, which occurs at low refresh frequencies when the luminance of a scene fluctuates periodically several times a second. As the fluctuation frequency increases, irritation rises and reaches a maximum at around 10 Hz, especially when bright flashes of illumination alternate with darkness. At higher refresh rates (frequencies), the scene no longer appears disjointed, and movement from one scene to the next is perceived to occur smoothly. Persistent flicker can occur at frequencies of several tens of hertz, beyond which the critical flicker frequency occurs in which flicker is no longer perceived. For this reason, motion pictures are projected at 36 Hz for silent film (at a rate of 18 frames/second, each frame interrupted once) and at 48 Hz (24 × 2) for sound film.
Critical flicker frequency rises substantially as the image becomes brighter or for larger fields of view. Images displayed at 30 Hz show considerable flicker, whereas those displayed at refresh rates above 60 Hz produce correspondingly reduced amounts of flicker as the refresh rate is steadily increased. To reduce flicker, video images in the 525/60 scan rate are presented at a refresh rate of 60 Hz rather than 30 Hz.
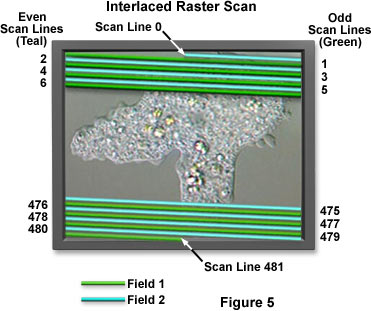
In the 525/60 format, each frame consists of 525 horizontal scan lines and is dissected into two interlaced fields, the first termed an odd field and the second an even field. Each field is composed of 262.5 scan lines and appears at a rate of 60 Hz. The result is each frame (a complete picture) appearing 30 times per second (30 Hz), with an overall field rate of 60 Hz to reduce or eliminate flicker. Thus, 525/60 refers to a scanning system with 525 horizontal scans per frame and a refresh rate of 60 fields per second (Hz). The individual even and odd fields, each with 262.5 non-identical horizontal lines, are interlaced along the vertical axis.
An interlaced raster scan in the North American format is presented in Figure 5, where the image is first scanned through every odd line of the frame (1st, 2nd, 3rd, etc.). The scan, which starts at the coordinates (0,0), continues for 262.5 times until it arrives at the bottom of the field where it reaches the end at a point halfway across the horizontal scan at X = 0.5 and Y = max. After the odd field is completed, the scanning spot flies back to the top and a second scan, the even field, is initiated. The even field scan starts at the middle of the top frame at coordinates (0.5,0) at ends at the lowest full-frame horizontal scan line (line 480 in Figure 5). Both the even and odd scans start their fields at Y = 0, the very top of the frame. Therefore, interlacing does not make the alternate fields start at different heights on the screen.
The even-field scan lines, whose starting point is shifted horizontally by H/2 relative to the start of the odd-field scan, fit neatly into the gap between the odd-field lines and vice versa. Including the half-line scan into both the even and odd scan fields allows for precise interlacing, which would not be possible if each field were composed of an integral number of lines. Depending upon the number of fields composing a frame, the interlace ratio can be 1:1, 2:1 (in the present example), or 4:1.
In the North American 525/60 scanning format, a field is repeated 60 times a second (60 Hz). Because there are 262.5 lines per field, the horizontal scan rate is (262.5 × 60) or 15,750 Hz. The horizontal scan interval is thus 63.5 microseconds (reciprocal of 15,750). Vertical scan rate is 60 Hz (vertical frequency), which yields a vertical scan interval of 16.67 milliseconds (262.5/15,750).
Blanking of the video signal reduces the number of active scan lines. For the vertical scan, the blanking time is approximately that of 21 horizontal scans, so the number of active scan lines is about 483 lines per frame ((262.5 - 21) × 2). Active scan lines are those that contribute to the active picture area, which is the area not blanked in the final scene displayed on the monitor.
The aspect ratio of the scanned field is defined as the ratio of the width to height of the active video frame, which is 4:3 for current broadcast-compatible video formats. Adherence to the standard aspect ratio prevents gross distortion of the image, such as a circle appearing as an ellipse. It should be noted that an aspect ratio of 1:1 is often used with CCTV (Electronic Industries Association specification RS-343).
In conclusion, we have reviewed the production of a linear series of electrical signals generated during a raster scan of a "live" image. The signals include the camera blanking pulses and the illumination intensity (brightness) at each point in the original image. By interlacing the scans, refresh frequencies that exceed the critical flicker point are readily obtained to produce video images that are pleasing to the eye.