Test Target Intensity Scans
Test Target Intensity Scans - Java Tutorial
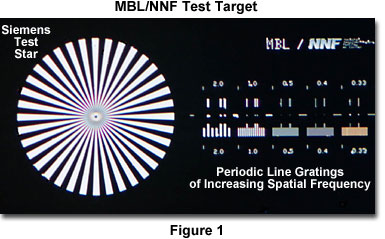
The optical performance of a light microscope is usually determined by its response when imaging high-contrast periodic line gratings that are employed to measure contrast transfer functions. An ideal test target (MBL-NNF) for this purpose was developed at the Marine Biological Laboratory in Woods Hole, Massachusetts in collaboration with the National Nanofabrication Facility at Cornell University.
In addition to the periodic line spacings, the MBL-NNF test target features both single and paired lines and dots and a Siemens test star (Figure 1), which allows a careful analysis of the diffraction patterns generated by these microscopic features as a function of illumination mode.

The interactive tutorial demonstrates intensity scans made from images of the periodic lines present on the MBL-NNF test target measured with a plan apochromatic objective. Gratings were imaged by a scanning laser microscope in the non-confocal transmission mode with a 40x/0.95 NA objective at a laser wavelength of 515 nanometers and a condenser numerical aperture of 0.82. Intensities were averaged over the dimension parallel to the grating lines. To view the entire range of intensities, move the slider to either the left (lower spatial frequencies) or right (higher spatial frequencies). Note that the intensity is dependent upon spatial frequency, being greatest at low frequencies and lowest at the higher frequencies.
Modulation of the output signal, the intensity of light waves forming an image of the specimen, corresponds to the formation of image contrast in microscopy. Therefore, a measurement of the MTF for a particular optical microscope can be obtained from the contrast generated by periodic lines or spacings present in a specimen that result from sinusoidal intensities in the image that vary as a function of spatial frequency. If a specimen having a spatial period of 1 micron (the distance between alternating absorbing and transparent line pairs) is imaged at high numerical aperture (1.40) with a matched objective/condenser pair using immersion oil, the individual line pairs would be clearly resolved in the microscope. The image would not be a faithful reproduction of the line pair pattern, but would instead have a moderate degree of contrast between the dark and light bars. Decreasing the distance between the line pairs to a spatial period of 0.5 microns (spatial frequency equal to 2000 lines per millimeter) would further reduce contrast in the final image, but increasing the spatial period to 2 microns (spatial frequency equal to 500 lines per millimeter) would produce a corresponding increase in image contrast.
The limit of resolution with an optical microscope is reached when the spatial frequency approaches 5000 lines per millimeter (spatial period equal to 0.2 microns), using an illumination wavelength of 500 nanometers at high numerical aperture (1.4). At this point, contrast would be barely detectable and the image would appear a neutral shade of gray. In real specimens, the amount of contrast observed in a microscope depends upon the size, brightness, and color of the image, but the human eye ceases to detect periodicity at contrast levels below about three to five percent for closely spaced stripes and may not reach the 0.2-micron limit of resolution.

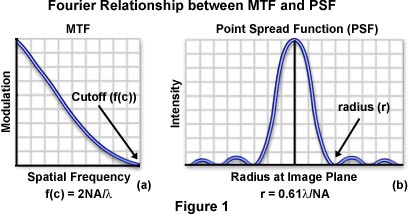
Eventually, the microscope reaches a limiting spatial frequency (the cutoff frequency), which is related to the objective numerical aperture (NA) and illumination wavelength (λ) by the following equation:
Cutoff Frequency (c(f)) = 2NAobj/λ
This relationship expresses, in terms of spatial frequency, the fact that resolution in the microscope increases with larger numerical apertures and shorter illumination wavelengths. Another indicator of optical resolution, the Raleigh two-point criterion, is based on the distribution width of the point spread function. Two points that are adjacent in a specimen are distributed by the optical system into two individual point spread functions. The width of these point spread function distributions determines how close the points can be to each other and still be resolved by the microscope.
When combined with the phase transfer function, the modulation transfer function of an optical system becomes the optical transfer function, which is the Fourier transfer of the point spread function. A fundamental property of Fourier transforms is that the distribution width of a function is inversely proportional to the distribution width of its Fourier transform. Considering the relationship between cutoff frequency and numerical aperture discussed above, the radius (r) of the first-order diffraction ring of the point spread function (or Airy disk) is expressed by the equation:
r = 0.61λ/NA
It is obvious that r and f(c) are inversely proportional to each other, as required by Fourier theory. It is important to note that the optical microscope does not suddenly stop resolving spacings that are less than the Abbe limit. Instead, there is a gradual drop in image contrast with increased spatial frequency that often renders specimens with low inherent contrast unresolvable even when they are spaced at distances greater than the resolution limit of the microscope.
Sorry, this page is not
available in your country.