Using cellSens Dimension software’s optional Count and Measure solution, counting objects in an image is a simple task. But what about counting objects within different regions? We’ve got you covered!
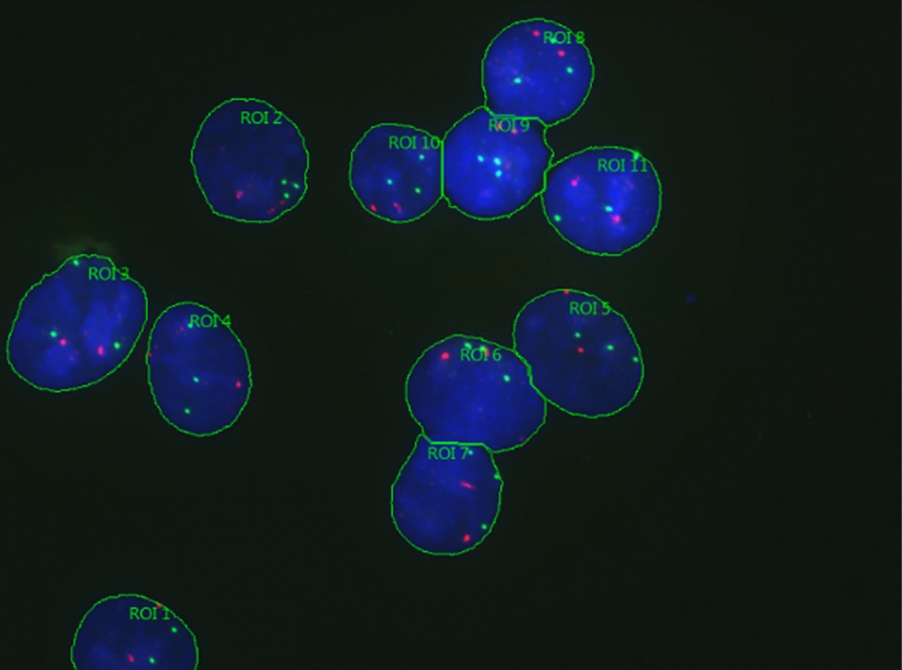
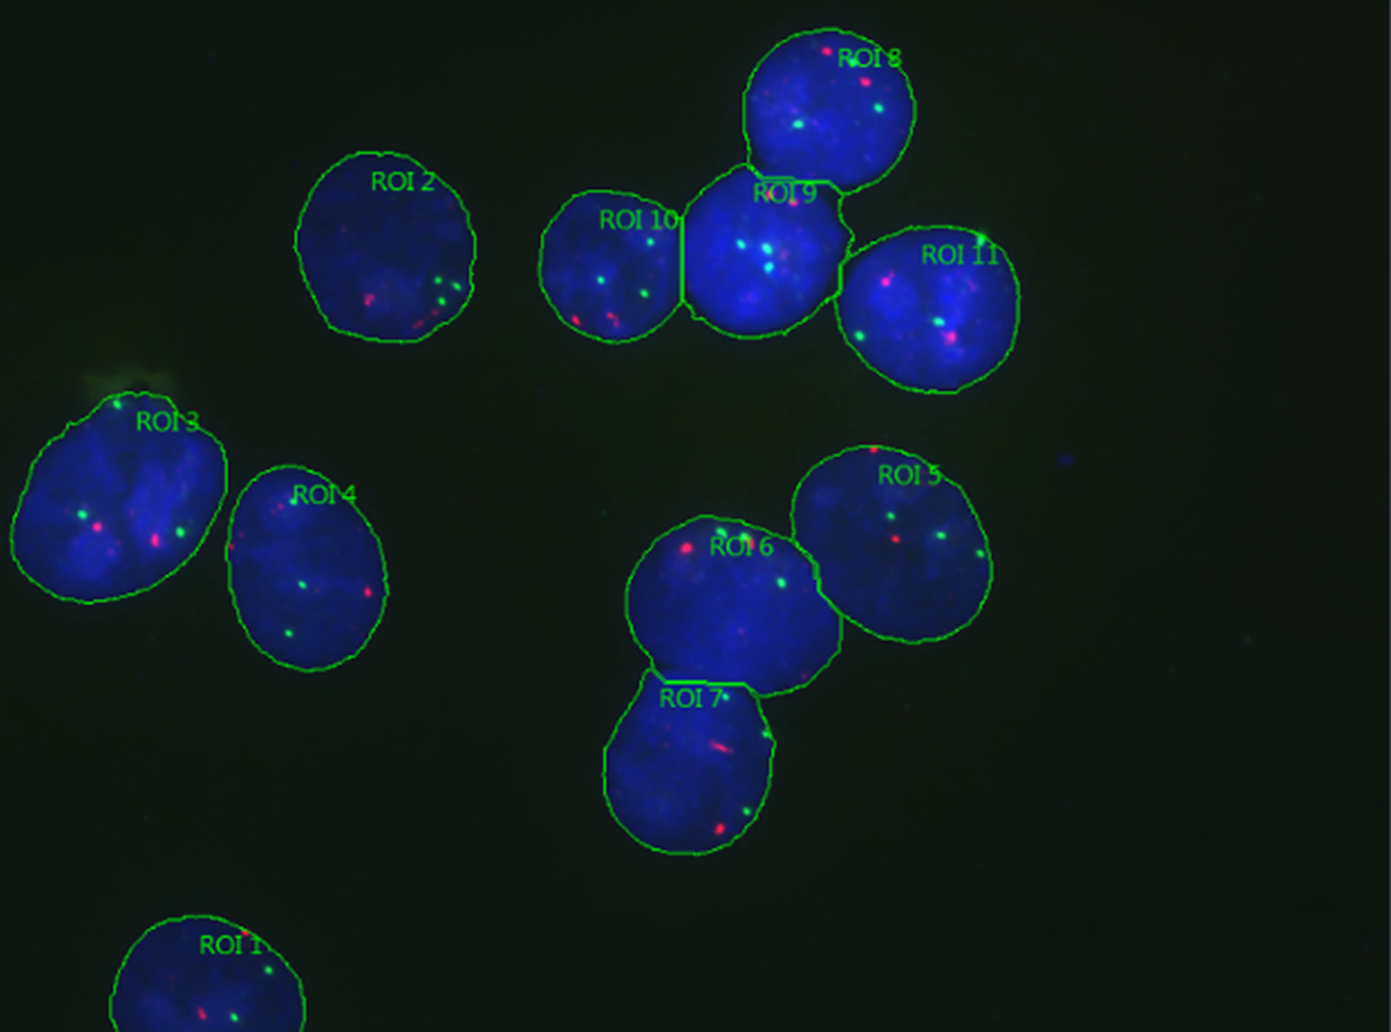
The example image we’re using here has three channels: blue, green, and red. Our goal is to count the number of green and red foci within each blue nuclear region.
Pro-Tip: Before you begin counting objects within regions in cellSens Dimension software, you should first define what measurements you want to make on the Options > Count and Measure > Measurements menu. Click Select Class Measurements and add the measurements you want to collect to the list. Each measurement has a quick description.
Defining Regions of Interest (ROI)
To segment out the blue nuclei, which we will later turn into regions for measurement:
- In the Dimension Selector tool window, select only the blue nuclei channel.
- Go to the Count and Measure tool window, manually set the threshold for the blue channel, and click Segment.
- Click Count and Measure to display results in the Count and Measure results tool window.
- Sort results per area and delete anything that is not a nucleus.
- Select all remaining objects and split nuclei manually if needed.
- You will now have more objects than you did previously. Once again, select all the objects in the image.
- Right click on the image and select Create ROIs from Selected Objects.
- Delete all the detected objects from the Count and Measure results tool window. They are no longer needed since the nuclei regions are now defined.
Detect Objects in Multiple Channels
Next, we’ll detect green and red objects within our blue nuclei.
To do this:
- Select the red and green channels in the Dimension Selector tool window
- Manually set the thresholds for both channels.
- Click the arrow next to the Count and Measure button and select Count and Measure on ROI.
- In your Count and Measure results tool window, switch to the Class Histogram tab.
- On the Measurement dropdown menu, select Object Count.
- Under the Grouped by menu, select the option for ROI. You will now have a histogram that shows the number of objects per region!
It’s that easy! We hope you found these tips and tricks helpful.
Related Content
A Video Introduction to Label-Free Nucleus Detection with TruAI Technology
5 Practical Ways to Accelerate Your Microscopy Experiments
Perform Accurate and Efficient Microscopy Image Analysis Using TruAI based on Deep Learning


