3D Analysis of Co-Culture Cancer Spheroids Using NoviSight™ Software
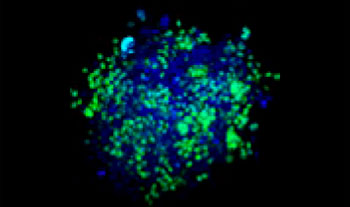
Confocal images of co-culture spheroids were quantitatively analyzed using NoviSight software to evaluate their cell population and determine drug sensitivity in each cell.
Introduction
Assessing the performance of a drug using three-dimensional cancer spheroids is important because the spheroids reflect the complicated in vitro microenvironment of the cancer. This enables researchers to evaluate a drug’s effectiveness under parameters that more closely resemble a tumor’s natural environment.
To test the applicability of NoviSight 3D analysis software to this application, we co-cultured cancer spheroids of A549 cells and HeLa cells. We then used NoviSight software to three-dimensionally analyze the effects of drug treatment on these cells. This study demonstrated that NoviSight software can be successfully used to classify objects according to the information they contain and to analyze the parameters of each to assess the effectiveness of a drug.
![]()
Graphical Abstract
 | |
 |  |
Benefits
- Based on the signals, two cell types can be classified, and we can perform population analysis.
- The drug efficacy can be spatially analyzed by separating the spheroid’s central and peripheral areas.
Methods
Cell preparation
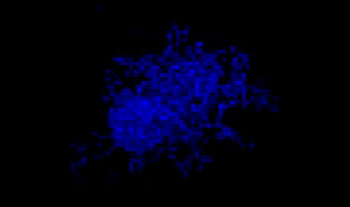
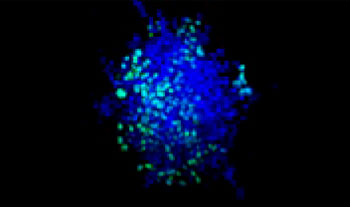
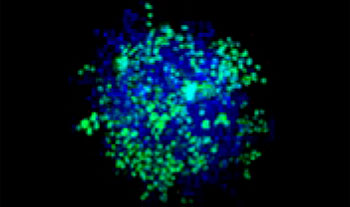
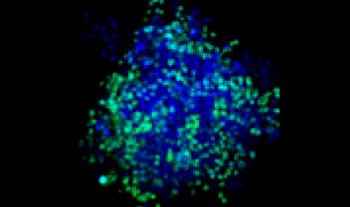
A549 human lung cells and HeLa cervical cancer cells (EGFP expressed in the nucleus) were mixed in a varying ratio. The ratio of HeLa cells was corrected based on the intensity of the EGFP signals (Fig. 1*1). The cells were seeded in a Corning® 384-well round-bottom plate (200 cells per well) and cultured for 3 days in DMEM with 10% FBS. The plate was gently centrifuged to remove any air bubbles in the wells.
A549: HeLa-EGFPnls
100:0
| 75:25
| 50:50
| 25:75
| 0:100
|
Figure 1. Prepared co-culture cancer spheroids*1
Sample preparation
The samples were treated with staurosporine (STS) for 5 hours at concentrations from 3.7 nM to 3.75 μM to achieve a 1:1 ratio of A549 and HeLa cells in the spheroids. Using the difference in membrane permeability, we determined cell viability by staining all nuclei with 10 μM of Hoechst33342 (DOJINDO) and the dead cell’s nuclei with 1 μM of TO-PRO3 (Thermo Fisher Scientific®). We then washed the samples three times with 1x PBS and fixed them with 4% paraformaldehyde overnight at 4 °C (39.2 °F). Before imaging, the spheroids were treated with SCALEVIEW-S4 (FUJIFILM Wako) tissue clearing reagent overnight at room temperature.
Image and analysis
Fluorescence images of spheroids were obtained using the FLUOVIEW® FV3000 confocal laser scanning microscope with an A Line super apochromat objective (UPLSAPO30XS). The objective’s correction collar was adjusted to match the refractive index of the immersion liquid to provide high-quality images and 3D morphology. Several of the images were imported to NoviSight™ 3D cell analysis software where they were reconstructed three dimensionally. The NoviSight software can recognize objects, such as nuclei, and perform various analyses the signals contained in the objects.
Results
Imaging drug sensitivity in co-culture spheroids
Making the spheroids transparent and imaging them with an FV3000 confocal laser scanning microscope enabled us to image the co-cultured cancer spheroids at depth. Staurosporine treatment increased the number of dead cells in a dose-dependent manner (Fig. 2*1). Three-dimensional analysis is required to determine which cells are dead and how many dead cells there are in a three-dimensional mass.
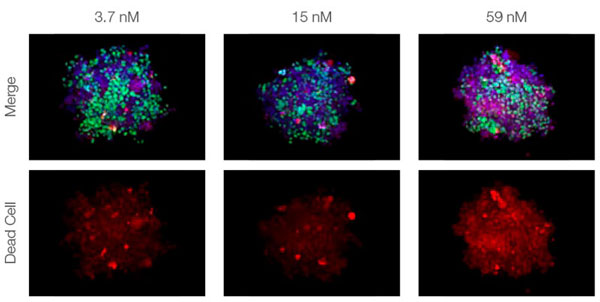
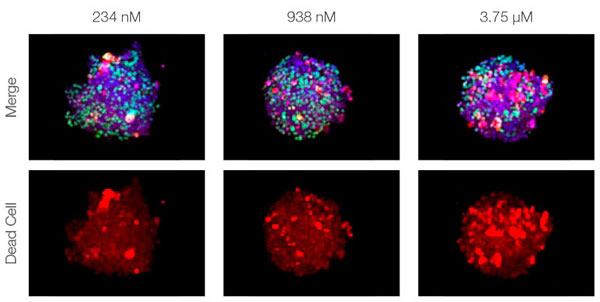
Figure 2. Drug response in co-culture spheroids*1
Analysis of drug sensitivity in co-culture spheroids
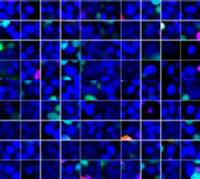
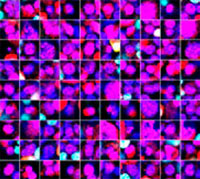
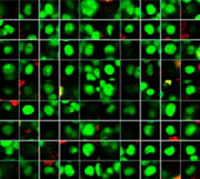
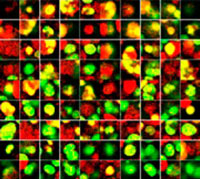
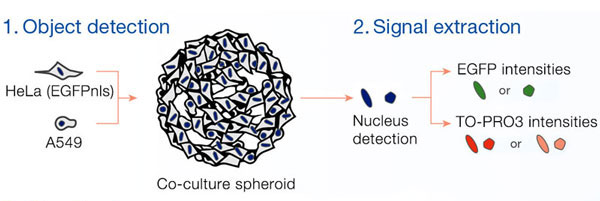
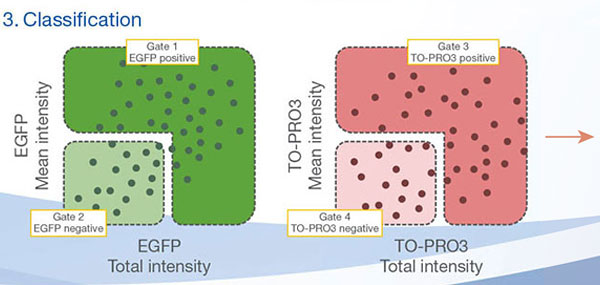
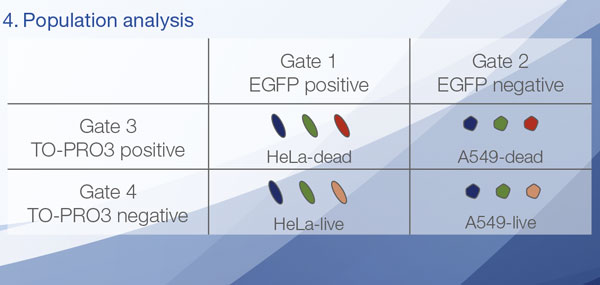
The Hoechst33342 signals enabled us to recognize the nuclei. All cells were classified into two groups based on the presence or absence of an EGFP signal—EGFP positive (HeLa cells) and EGFP negative (A549 cells). The cells in these two groups were further divided according to the presence or absence of dead cell signals (TO-PRO3, red) for a total of four groups (Fig. 3*1). The percentage of live to total cells of both A549 and HeLa cells was calculated and plotted (Fig. 4). The results showed that HeLa cells were more sensitive to staurosporine than A549 cells.
Using NoviSight™ software, it was possible to classify the cell types contained in each co-culture cancer spheroid and analyze cell-type-specific drug responsiveness.
| Gallery |
|
|
|
|
| Hoechst | + | + | +*2 | +*2 |
| EGFP | - | - | + | + |
| TO-PRO-3 | - | + | - | + |
Figure 3. NoviSight software can classify the cells into 4 groups based on the signals*1
*2 The right two galleries don’t display the Hoechst signals
Staurosporine concentration
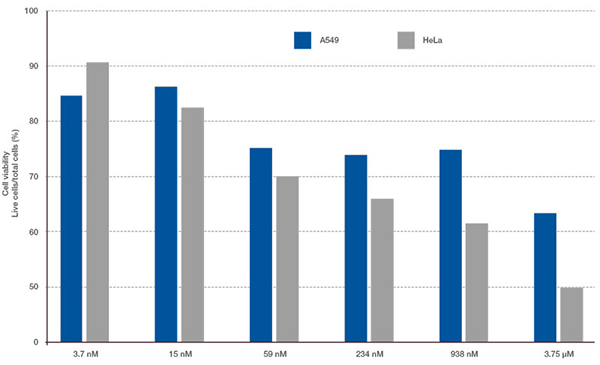
Figure 4. Difference in drug responsiveness between A549 cells and HeLa cells
Spatial analysis strategy
The images are captured three dimensionally so that more complicated spatial analysis can be performed. This enables the analysis of cell behavior in heterologous tissues, like cancer. NoviSight™ software can set the region to be analyzed. We set the software to analyze both the center and periphery of each spheroid and created eight groups (Fig. 5). We then performed population analysis within these areas (Fig. 6). This method allows spatial analysis of drug efficacy in co-culture cancer spheroids.
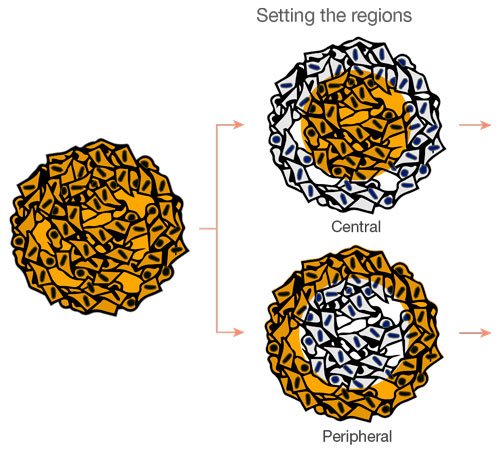 | 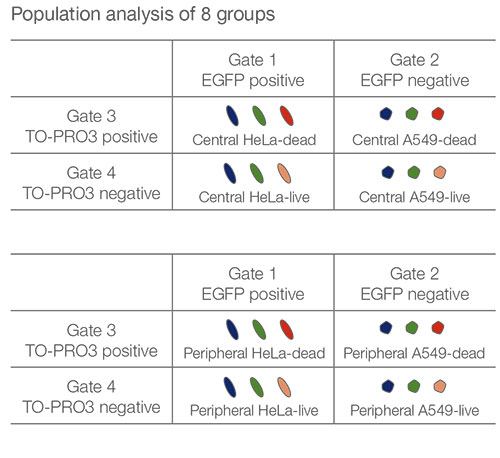 |
Figure 5. Schematic diagram of spatial analysis
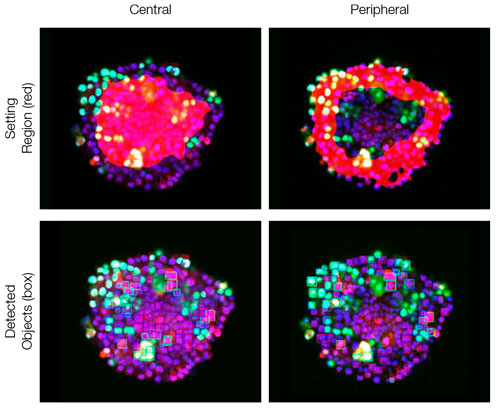
Figure 6. NoviSight software can classify both the central and peripheral parts
Spatial analysis of drug efficacy
NoviSight™ software can not only count the number of dead cells, but also analyze the spatial effectiveness of the drug. To demonstrate this functionality, we performed a spatial analysis of each dead cell in the co-culture spheroids. The ratio of each dead cell to the number of cells in the central and periphery areas was calculated (Fig. 7). In this case, there was no difference in the drug efficacy between these two regions. The number of dead cells in both the center and the periphery increased in a dose-dependent manner.
Staurosporine concentration
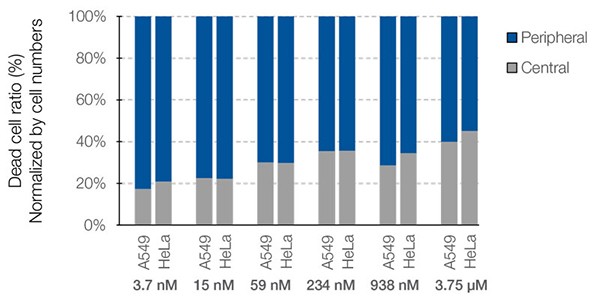
Figure 7. Difference in drug responsiveness between the central and peripheral regions
Conclusion
Using NoviSight software and the FLUOVIEW® FV3000 confocal laser scanning microscope, it was possible to classify the types of cells contained in co-culture cancer spheroids and analyze the cell-type-specific drug responsiveness. By changing the combination of co-cultures, the microenvironment of various cancers can be successfully reproduced and the efficacy of anticancer drugs can be evaluated.
Authors
Hiroya Ishihara, Biological Evaluation Technology 2, Research and Development
*1 Although it became one of the most important cell lines in medical research, it’s imperative that we recognize Henrietta Lacks’ contribution to science happened without her consent. This injustice, while leading to key discoveries in immunology, infectious disease, and cancer, also raised important conversations about privacy, ethics, and consent in medicine.
To learn more about the life of Henrietta Lacks and her contribution to modern medicine, click here.
http://henriettalacksfoundation.org/
Products Related to This Application
was successfully added to your bookmarks
Maximum Compare Limit of 5 Items
Please adjust your selection to be no more than 5 items to compare at once
Not Available in Your Country
Sorry, this page is not
available in your country.
